QUICK AND EASY STEPS TO SUBSCRIBE, INSTALL AND FORMAT STOCKDOTGENIE OR SWING•GENIE INTO YOUR TRADINGVIEW CHARTS.
1) Load the site tradingview.com.
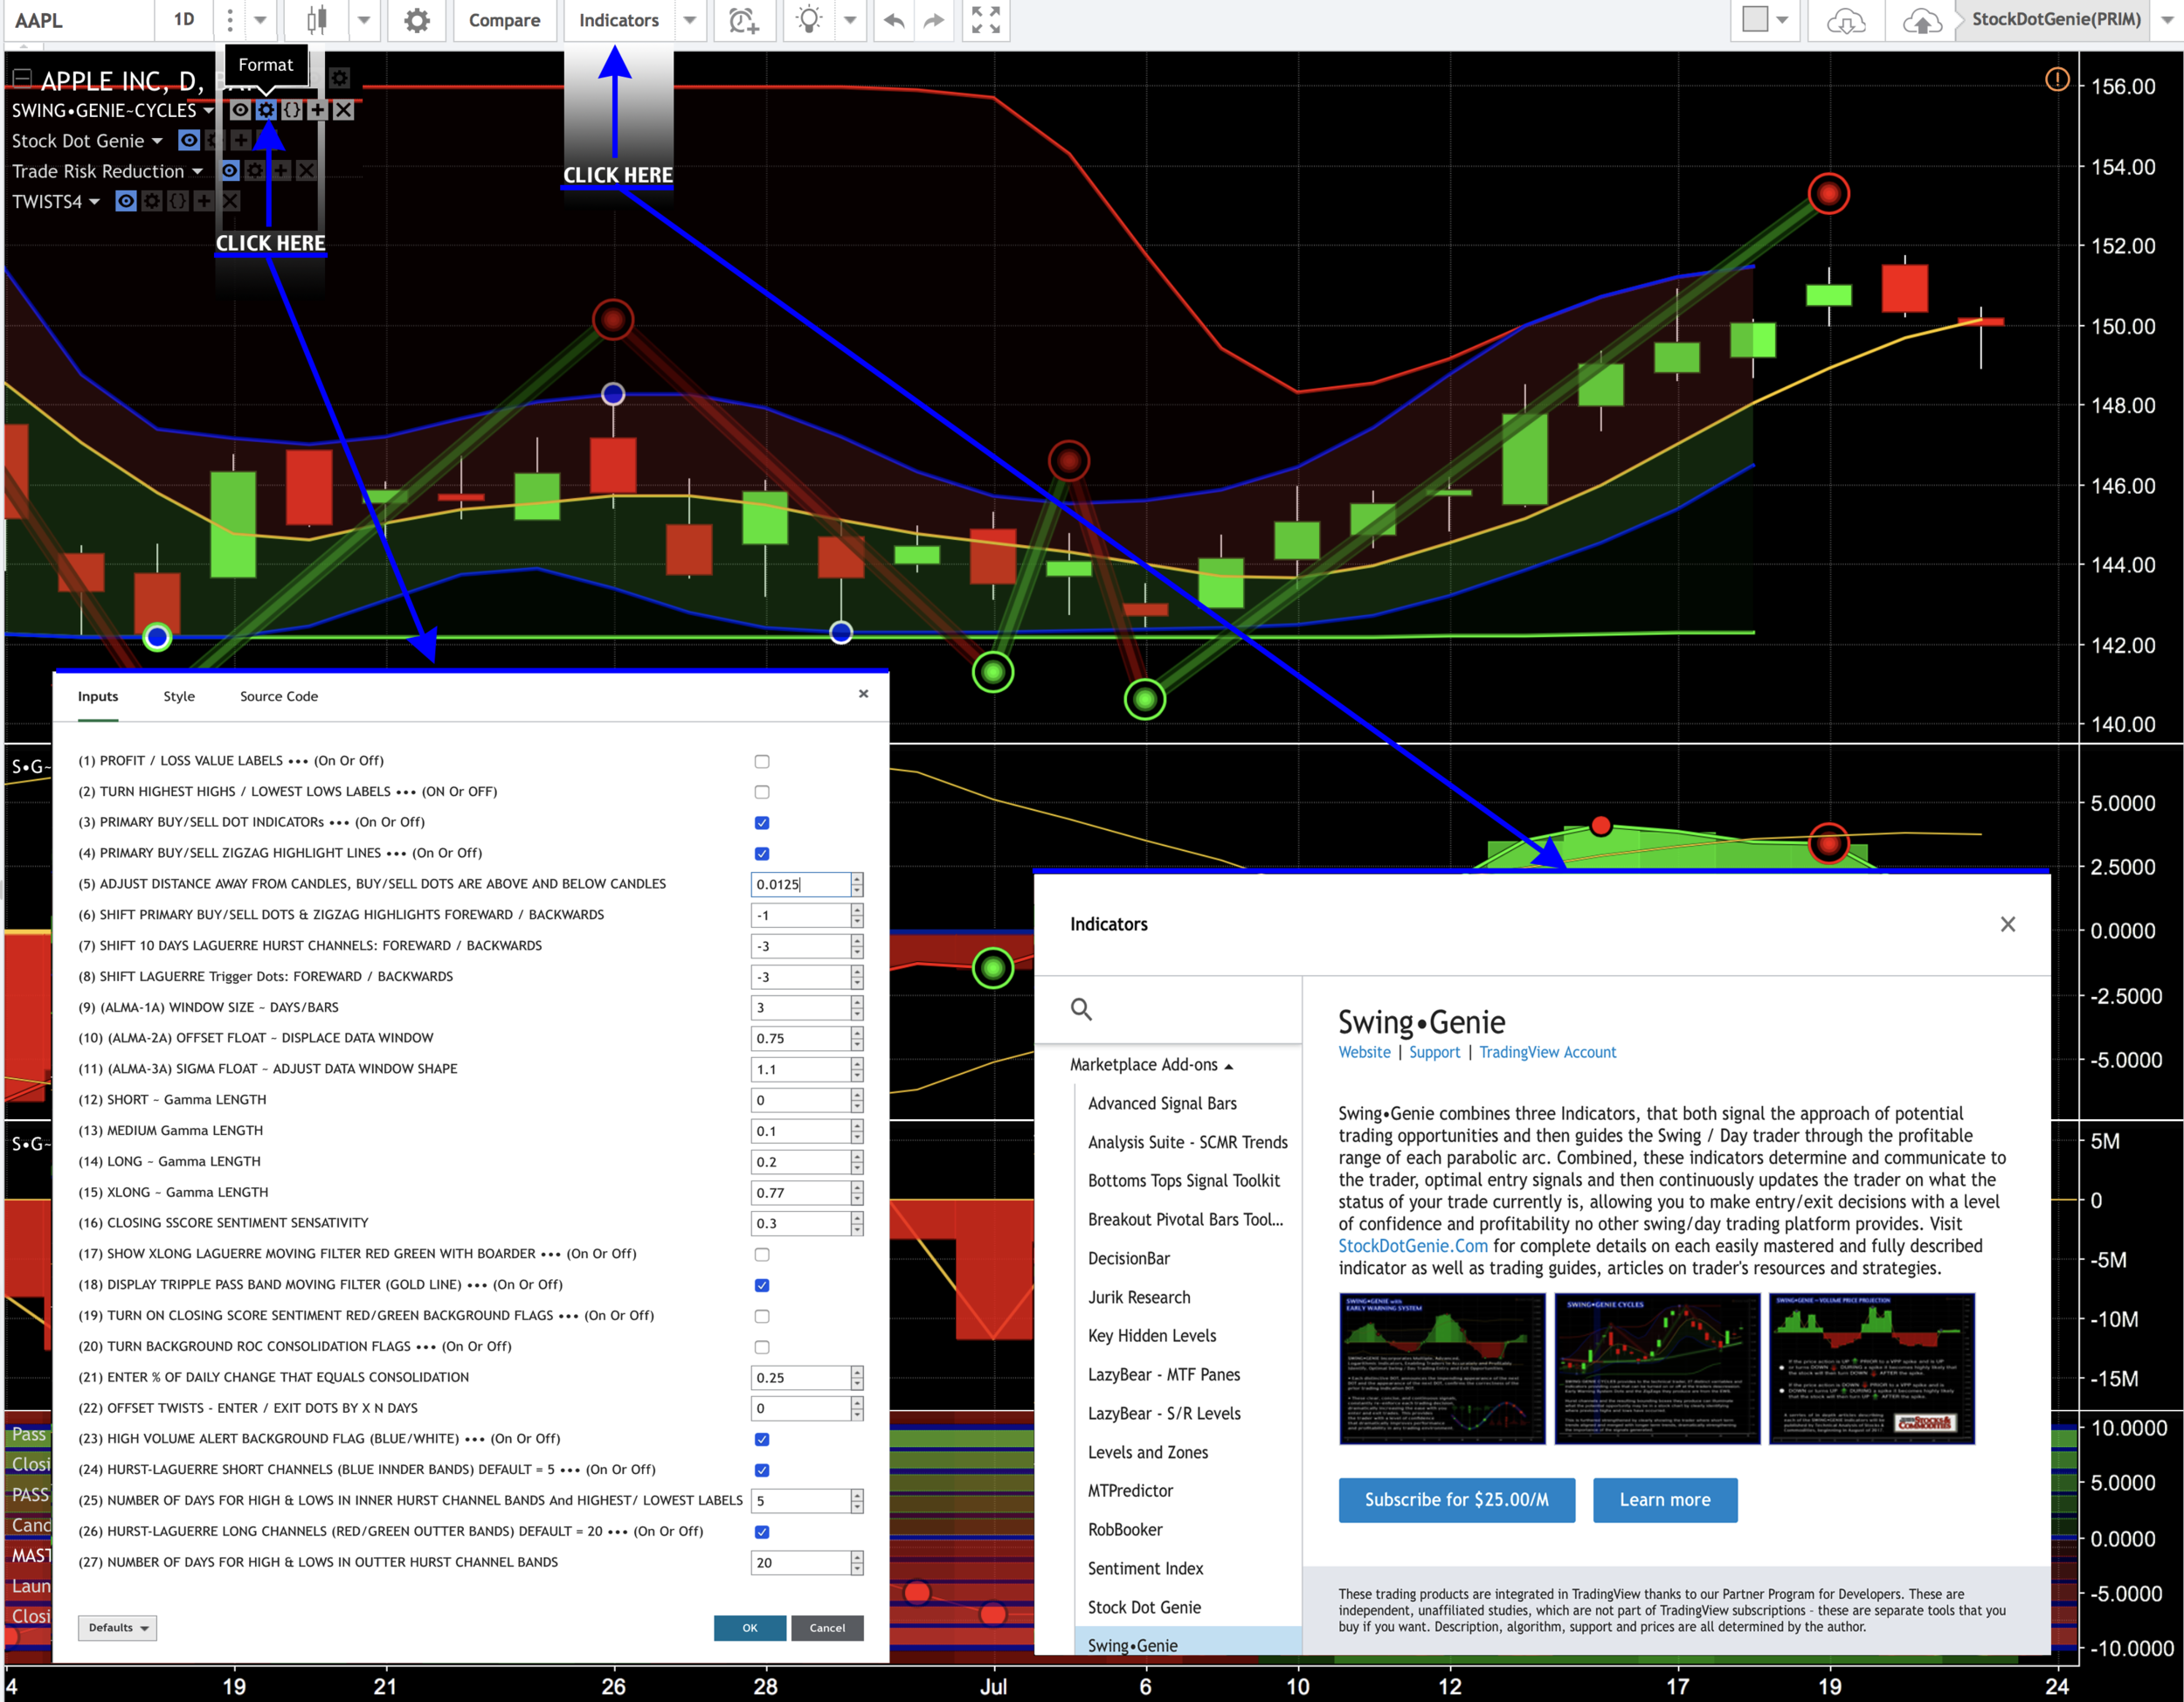
2) At the top of the chart, you want to click on the “Indicator's” tab. Note; you want to click on the word, not the arrow just to the right of the Indicators name. See annotated screen shot below.
3) Scroll down to “Marketplace Add-ons.” See the blow-up of "Indicators" on right side at bottom of image below.
4) Within “Marketplace Add-ons,” select "StockDotGenie," or “SWING•GENIE.”
5) Click on the “Subscribe button.
Once you have subscribed you want to return to step 4.
6) This time the individual indicators will appear.
7 -9) By clicking each of the indicators, they will be individually added to your chart.
At the bottom of this page is a screen shot of how they appear on my computer.
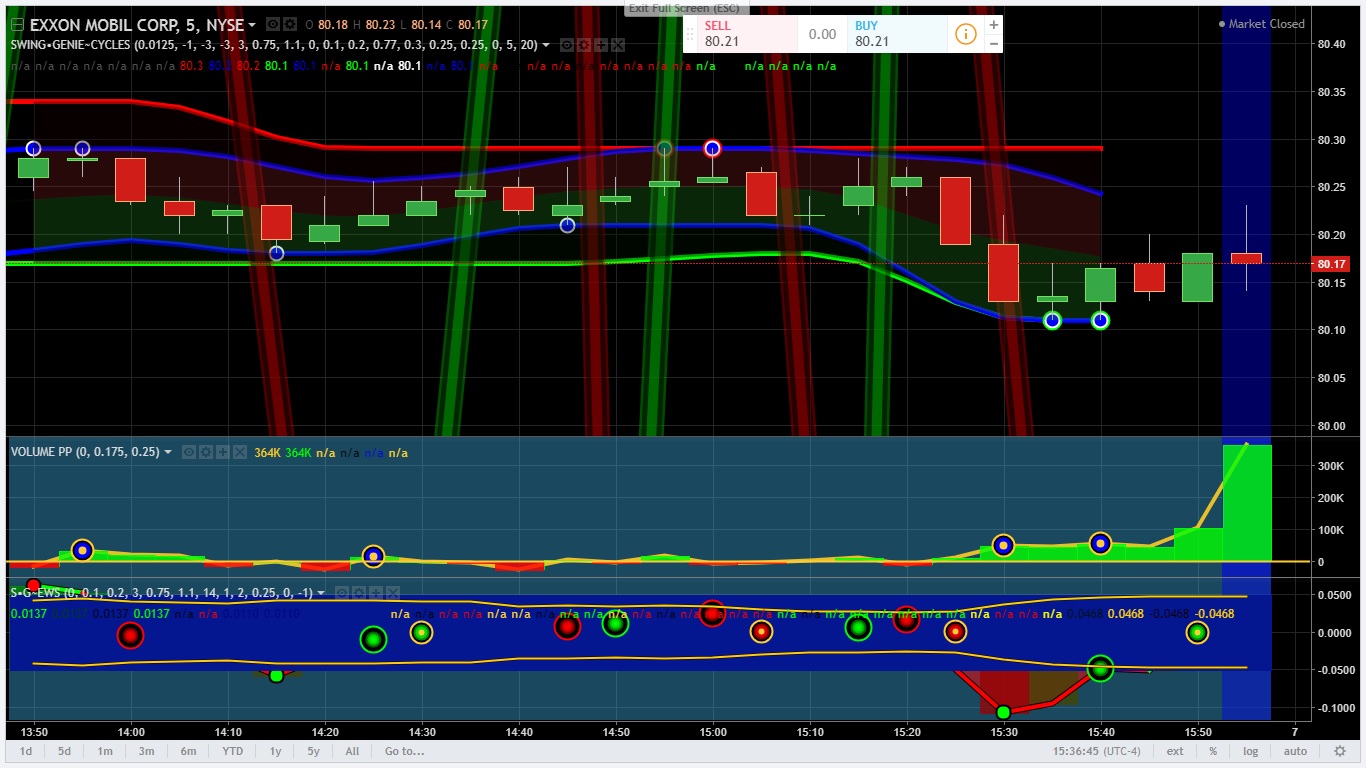
Cycles is an Overlay chart meaning it is designed to be utilized on top of your primary candlestick chart.
ACCESSING THE FORMAT PANEL &
FORMATTING YOUR INDICATORS

Accessing the format panel is simple.
Next, to each indicator's name, there are a series of small icons. See the blue "Format" label on the left hand side and top of the image above for its exact location. That image is enlarged here on the right.
The first one (T) drops down the panel that allows you to arrange the indicators on your chart. See next header section for more details.
(1) Makes the indicator visible or invisible. Turning this indicator off does not remove it from your chart.
(2) opens the format panel for this indicator.
(3) In this example, the parentheses allow programmer access to their code. You probably will not be seeing this option.
(4) Allows you to add the current indicator to another indicator.
(5) Deletes (removes) the indicator from the current indicator pane.
Changing the indicators input values allows you to adjust your indicators to optimize them for your trading style.
Many new users have encountered very complicated and crowded charts. Reducing the number of background flags or turning them all off will clear up your charts. Most of the background flags where intended to be utilized as needed and on a temporary basis.
Below is a screenshot of the format panel for the SWING•GENIE Cycles indicator.

• ARRANGING INDICATORS ON YOUR CHART -
MERGING AND UNMERGING •
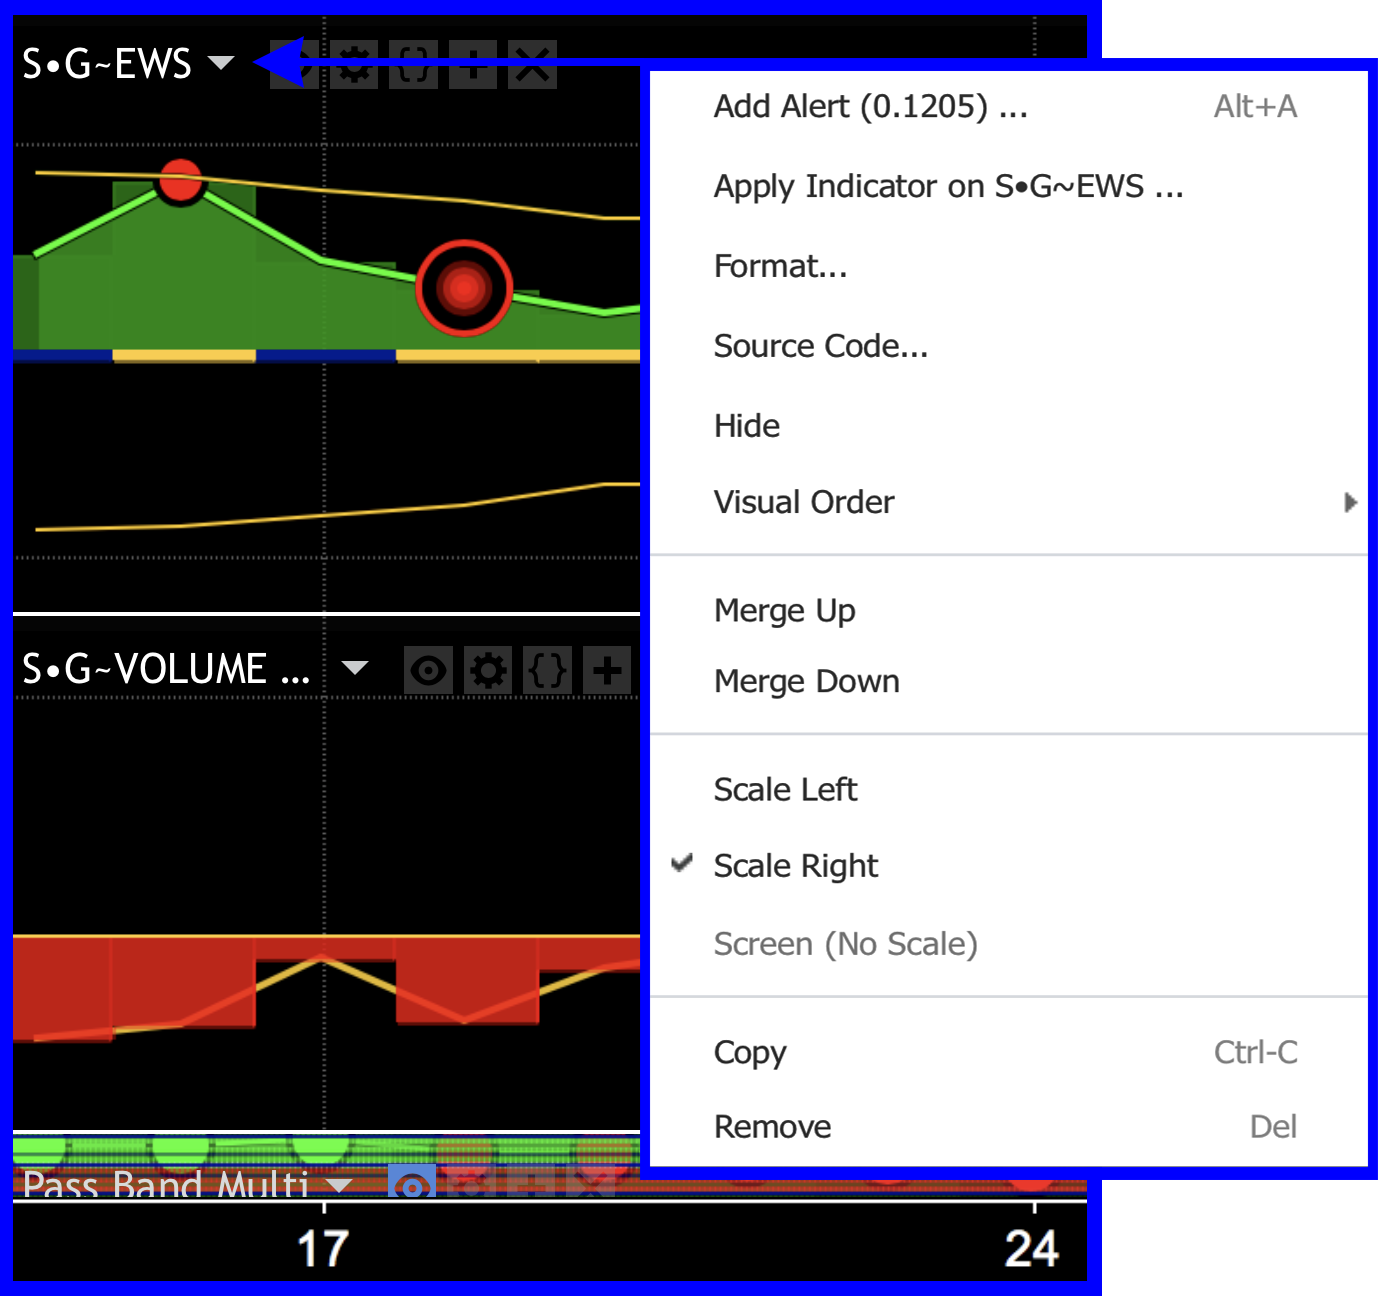
It is very easy to arrange your indicators on your Tradingview charts.
Click on the small triangle next to your indicator's name. This will drop down a menu that allows the user to 1) Move Up the indicator into the next indicator panel above. 2) Move Down the indicator into the next indicator panel below. Both of these options produce new trading indicator panels so that they will exist in their own indicator panel. 3) Merge Up and 4) Merge Down moves the current indicator into the panel with other indicators. You then use the format icons next to your indicator name to selectively turn them on or off. These are described in the Formatting You Indicators in the section above this one.
DARK TRADINGVIEW CHART OPTION NOW A SINGLE CLICK √
SWING•GENIE has been designed to be displayed on a black background. All of the color and shading choices that were made during the design of these indicators were made to make them distinct and easily differentiated from signals that may get generated close to each other. It is now very easy to click one button on your chart preferences panel and switch to the color pallet that the indicators where designed on and for. Click on the image below to go directly to Tradingview's Dark option instruction page.

MY SWING•GENIE CHART SETUP
I have always utilized black backgrounds on my charts. I find that this configuration allows me to design color schemes that allow the focus to be entirely on the data being illustrated. Tradingview has made this setup extremely simple. Just select Dark theme from the "Chart Properties," sprocket. Blue lines below point the way.

• TURN OFF THE CENTER CONSOLIDATION LINE FOR THE EARLY WARNING SYSTEM INDICATOR WHEN THE TIME FRAME YOU ARE VIEWING CHARTS IN IS LESS THAN 1 DAY •
Below are two examples of a chart with this consolidation line on. 1) is a daily chart of the symbol QQQ. 2) is a 15-minute chart of the same symbol. The center demarcation line when toggled on to indicated periods of consolidation can obscure critical information in your chart at any time frame below 1 DAY and you are better served by turning it off in shorter time frames.
There is also the option of turning on a background flags ((20) in the format panel) to indicate periods of consolidation. This is great when attempting to ascertain if your stock is within a period of consolidation and occurs at the apex or vertex of a parabolic swing.

• PROBLEMS A FEW OF OUR TRADER HAVE ENCOUNTERED •
The issues demonstrated below can all be resolved by reading the instruction at the beginning of this page. If you have any problems not resolved by these instructions please don't hesitate to use the contact link at the bottom of this page.