


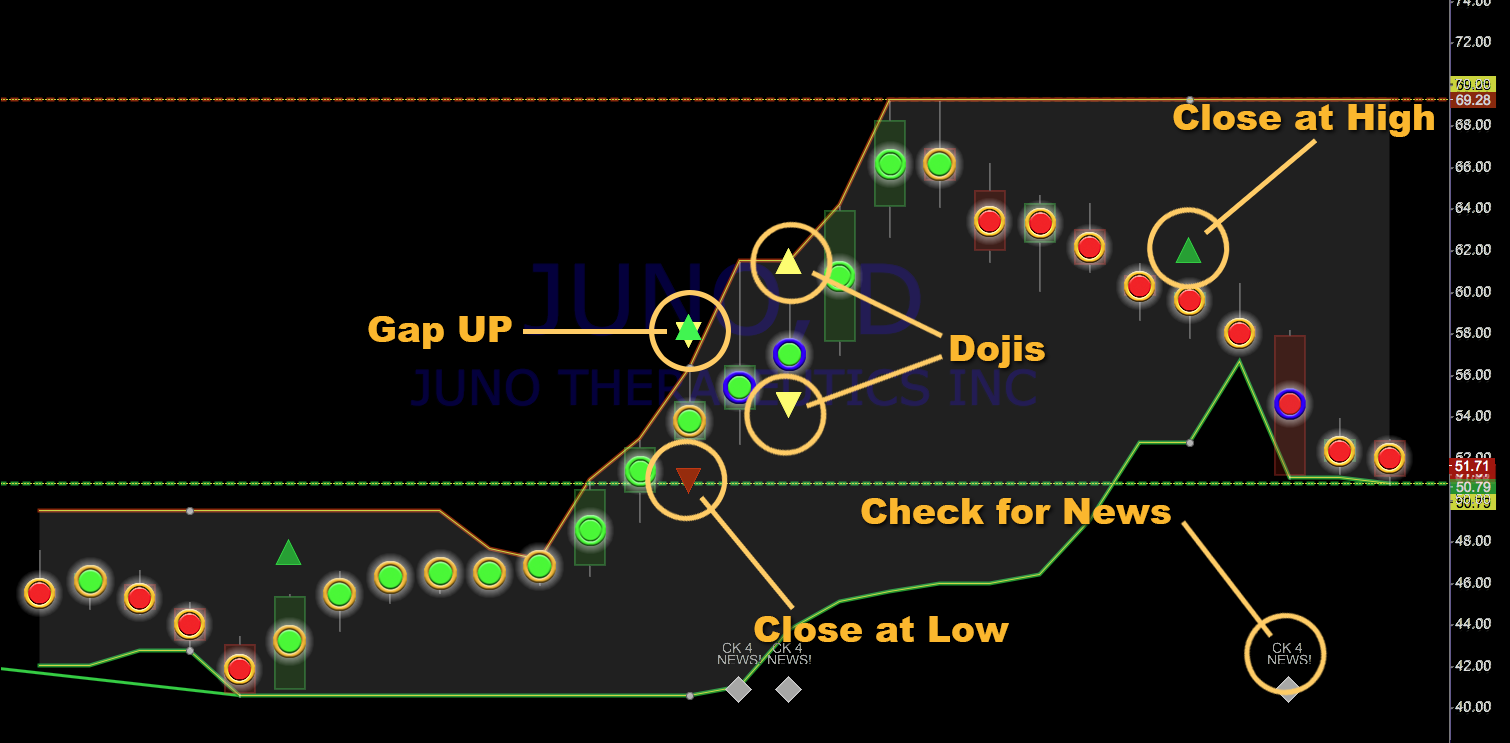
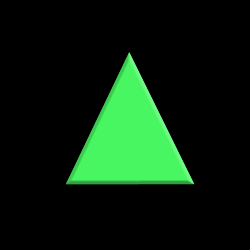


Closing price was at the upper extreme of the entire trading range for the day. This indicates very strong motivation and positive sentiment. This flag will appear above the candle.
Positive Sentiment
||||||||||||||||||||||||||||||||||||||||||||||||||||||||||||||||||||||||||||||||||
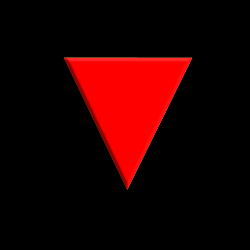
Closing price was at the lower extreme of the entire trading range for the day. This indicates a complete lack of motivation and negative sentiment. This flag will appear below the candle.
Negative Sentiment
||||||||||||||||||||||||||||||||||||||||||||||||||||||||||||||||||||||||||||||||||
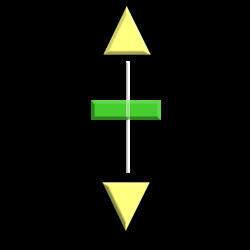
A Dolji indicates indecision and can indicate a tie between the two opposing forces competing for control. On low volume it can mean very little. On high volume it will often indicated an impending change in direction of price.
||||||||||||||||||||||||||||||||||||||||||||||||||||||||||||||||||||||||||||||||||
A Gap Up in price at the opening is indicated by the following green/gold star. Appears above the candle.
Demonstrates a strong increase in positive motivation/sentiment.
||||||||||||||||||||||||||||||||||||||||||||||||||||||||||||||||||||||||||||||||||
A Gap Down in price at the opening is indicated by the red/gold star. Appears below the candle.
Demonstrates a strong increase in negative sentiment/motivation.
|||||||||||||||||||||| CONTINUATION |||||||||||||||||||||||
|||||||||||||||||||||||||||| SDG DOTS |||||||||||||||||||||||||||
Green/Green: Outside-Ring indicates that the volume, price change and body size are all larger than the average of the same parameters over the last five days. Inside-Dot indicates PDC or MMAE are indicating a positive pressure on price.
||||||||||||||||||||||||||||||||||||||||||||||||||||||||||||||||||||||||||||||||||
Red/Green: Outside-Ring indicates that the volume, price change and body size are all smaller than the average of the same parameters over the last five days. Inside-Dot indicates PDC or MMAE are indicating a positive pressure on price.
||||||||||||||||||||||||||||||||||||||||||||||||||||||||||||||||||||||||||||||||||
Gold/Green: Outside-Ring indicates that one or more of the critical ring parameters; volume, price change or body size, were within the normal averages for the last five days. Inside-Dot indicates PDC or MMAE are indicating a positive pressure on price.
||||||||||||||||||||||||||||||||||||||||||||||||||||||||||||||||||||||||||||||||||
Blue/Green: Outside-Ring indicates that volume is greater than 1.6 times the average volume over the previous 28 days. When you see these spikes in volume it often indicates a positive news event.
||||||||||||||||||||||||||||||||||||||||||||||||||||||||||||||||||||||||||||||||||
Red/Red: Outside-Ring indicates that the volume, price change and body size are all smaller than the average of the same parameters over the last five days. Inside-Dot indicates PDC or MMAE are indicating a negative pressure on price.
||||||||||||||||||||||||||||||||||||||||||||||||||||||||||||||||||||||||||||||||||
Green/Red: Outside-Ring indicates that the volume, price change and body size are all larger than the average of the same parameters over the last five days. Inside-Dot indicates PDC or MMAE are indicating a negative pressure on price.
||||||||||||||||||||||||||||||||||||||||||||||||||||||||||||||||||||||||||||||||||
Gold/Red: Outside-Ring indicates that one or more of the critical ring parameters; volume, price change or body size, were within the normal averages for the last five days. Inside-Dot indicates PDC or MMAE are indicating a negative pressure on price.
||||||||||||||||||||||||||||||||||||||||||||||||||||||||||||||||||||||||||||||||||
Blue/Red: Outside-Ring indicates that volume is greater than 1.6 times the average volume over the previous 28 days. When you see these spikes in volume it often indicates a negative news event.
||||||||||||||||||||||||||||||||||||||||||||||||||||||||||||||||||||||||||||||||||
Dark Blue background behind candles and dots. Indicates that the volume is greater than 1.6 time the average volume over the previous 28 days. When you see these spikes in volume your need to investigate why! Even if you don't own this stock an opportunity may be presenting itself. You will see the "Check for News" flag at the bottom of each Volume Flag.


