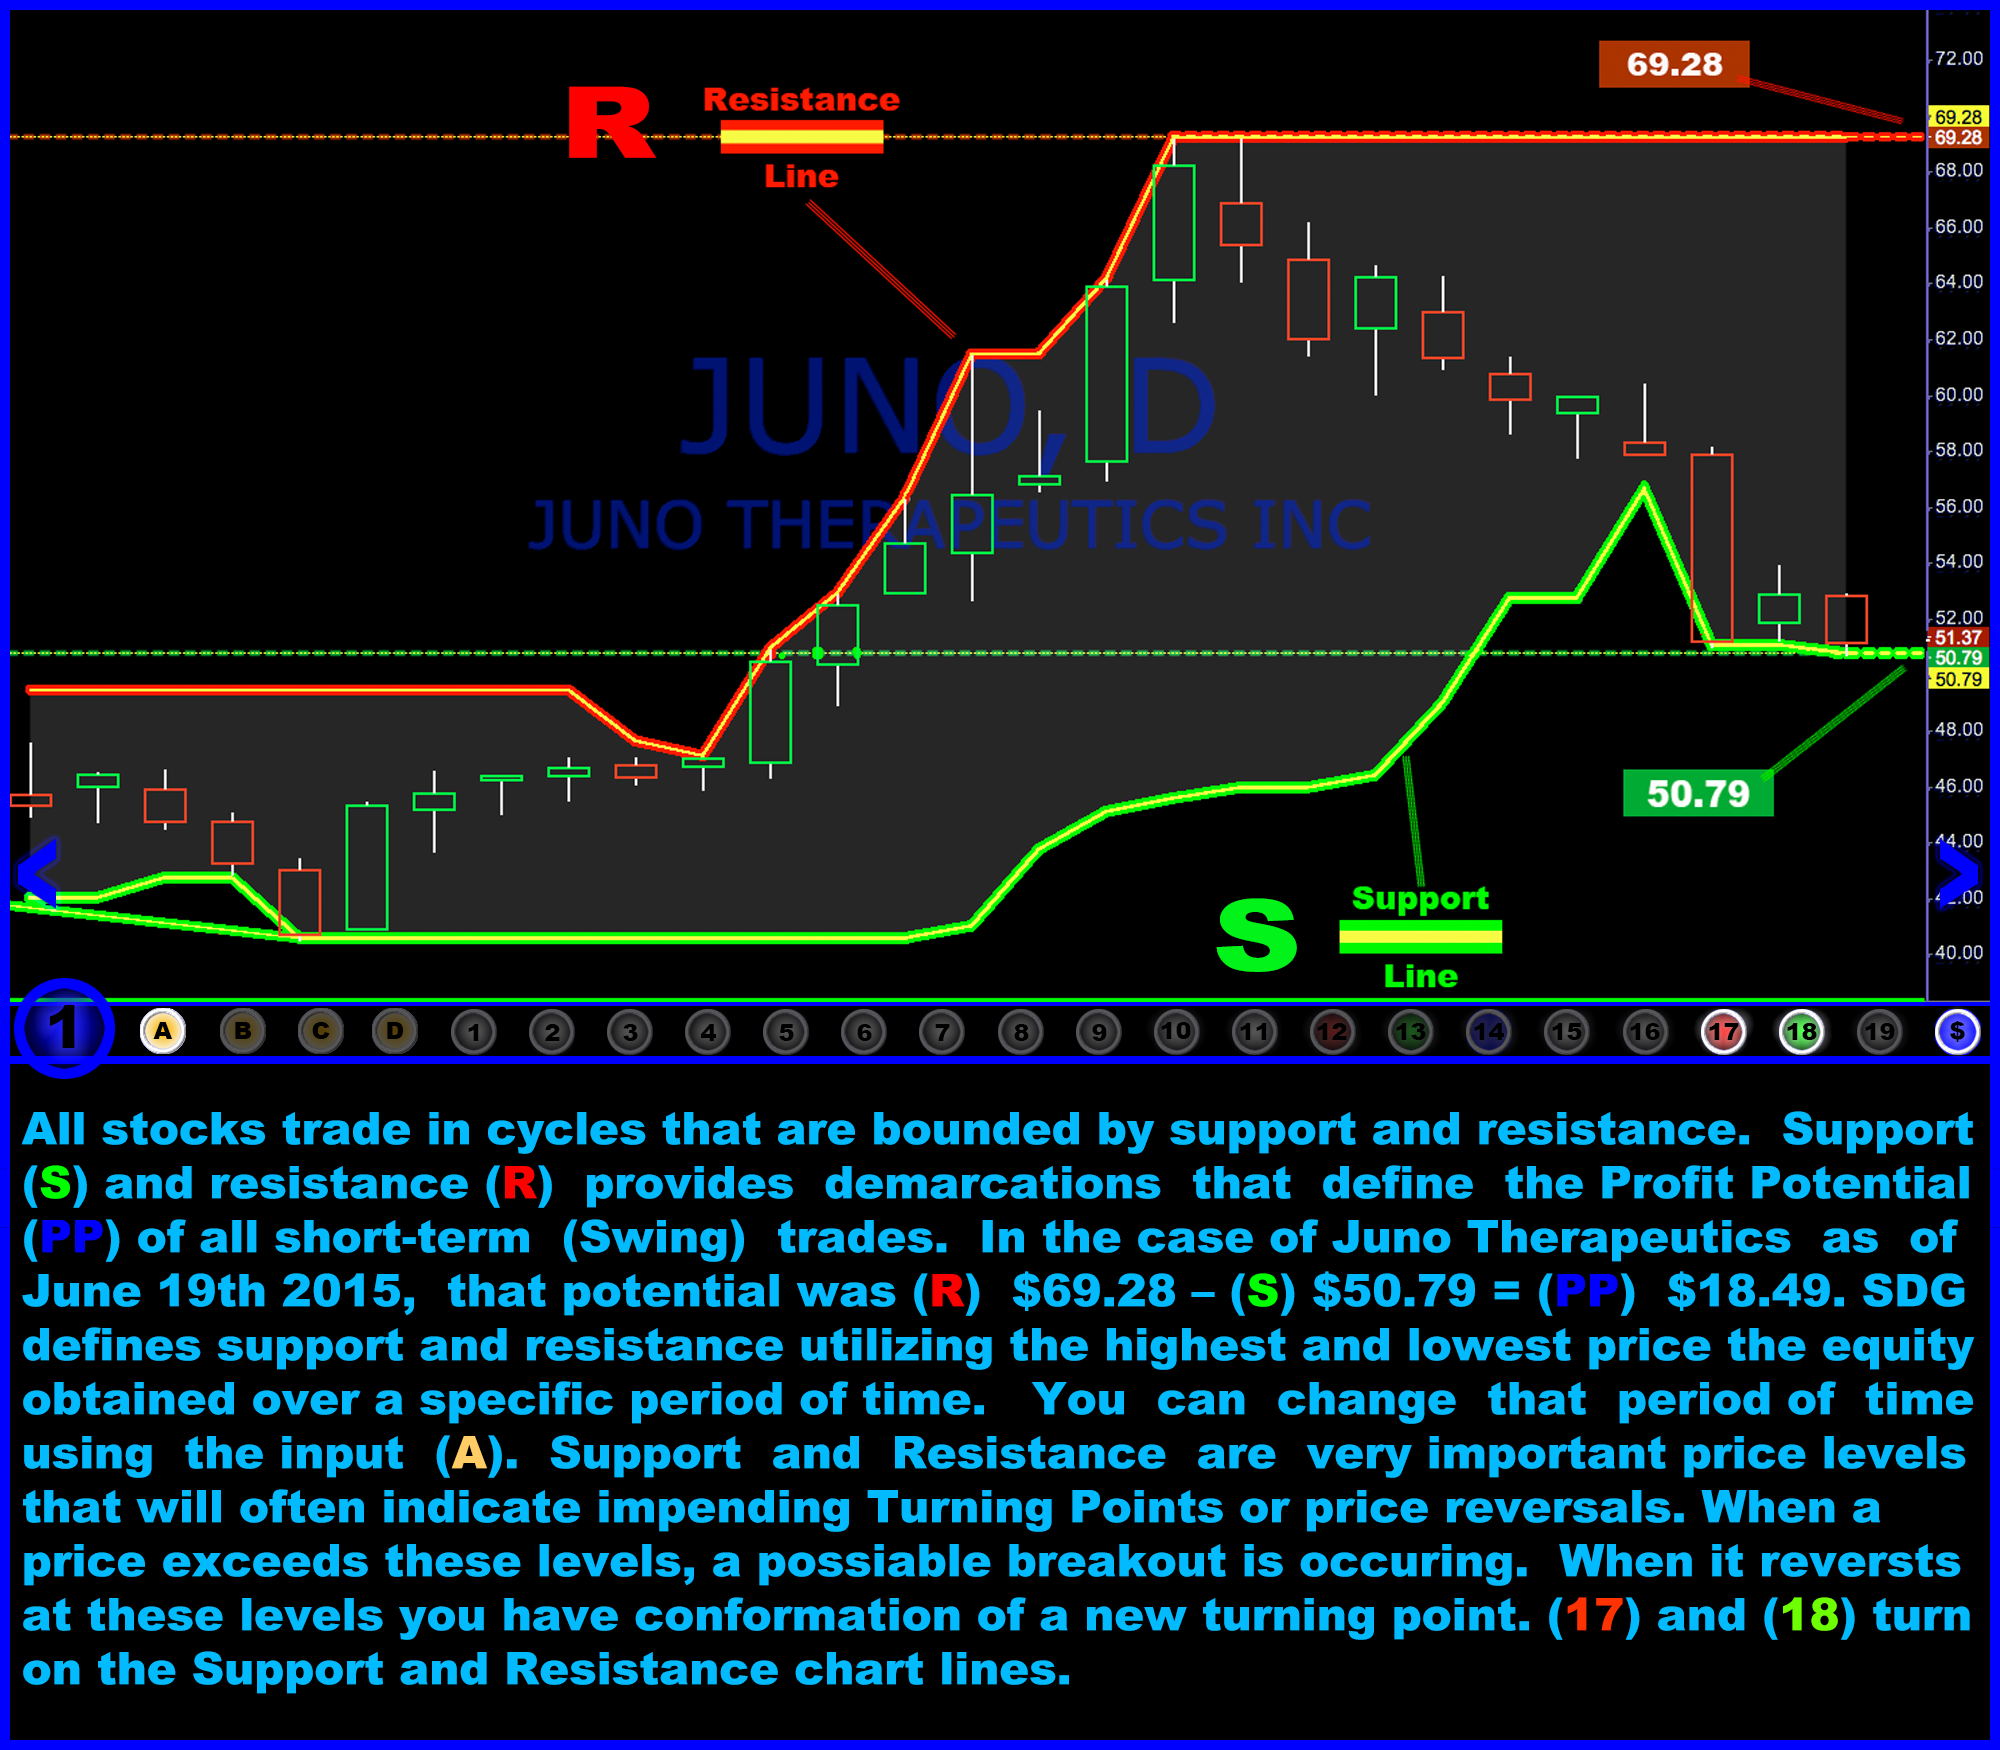
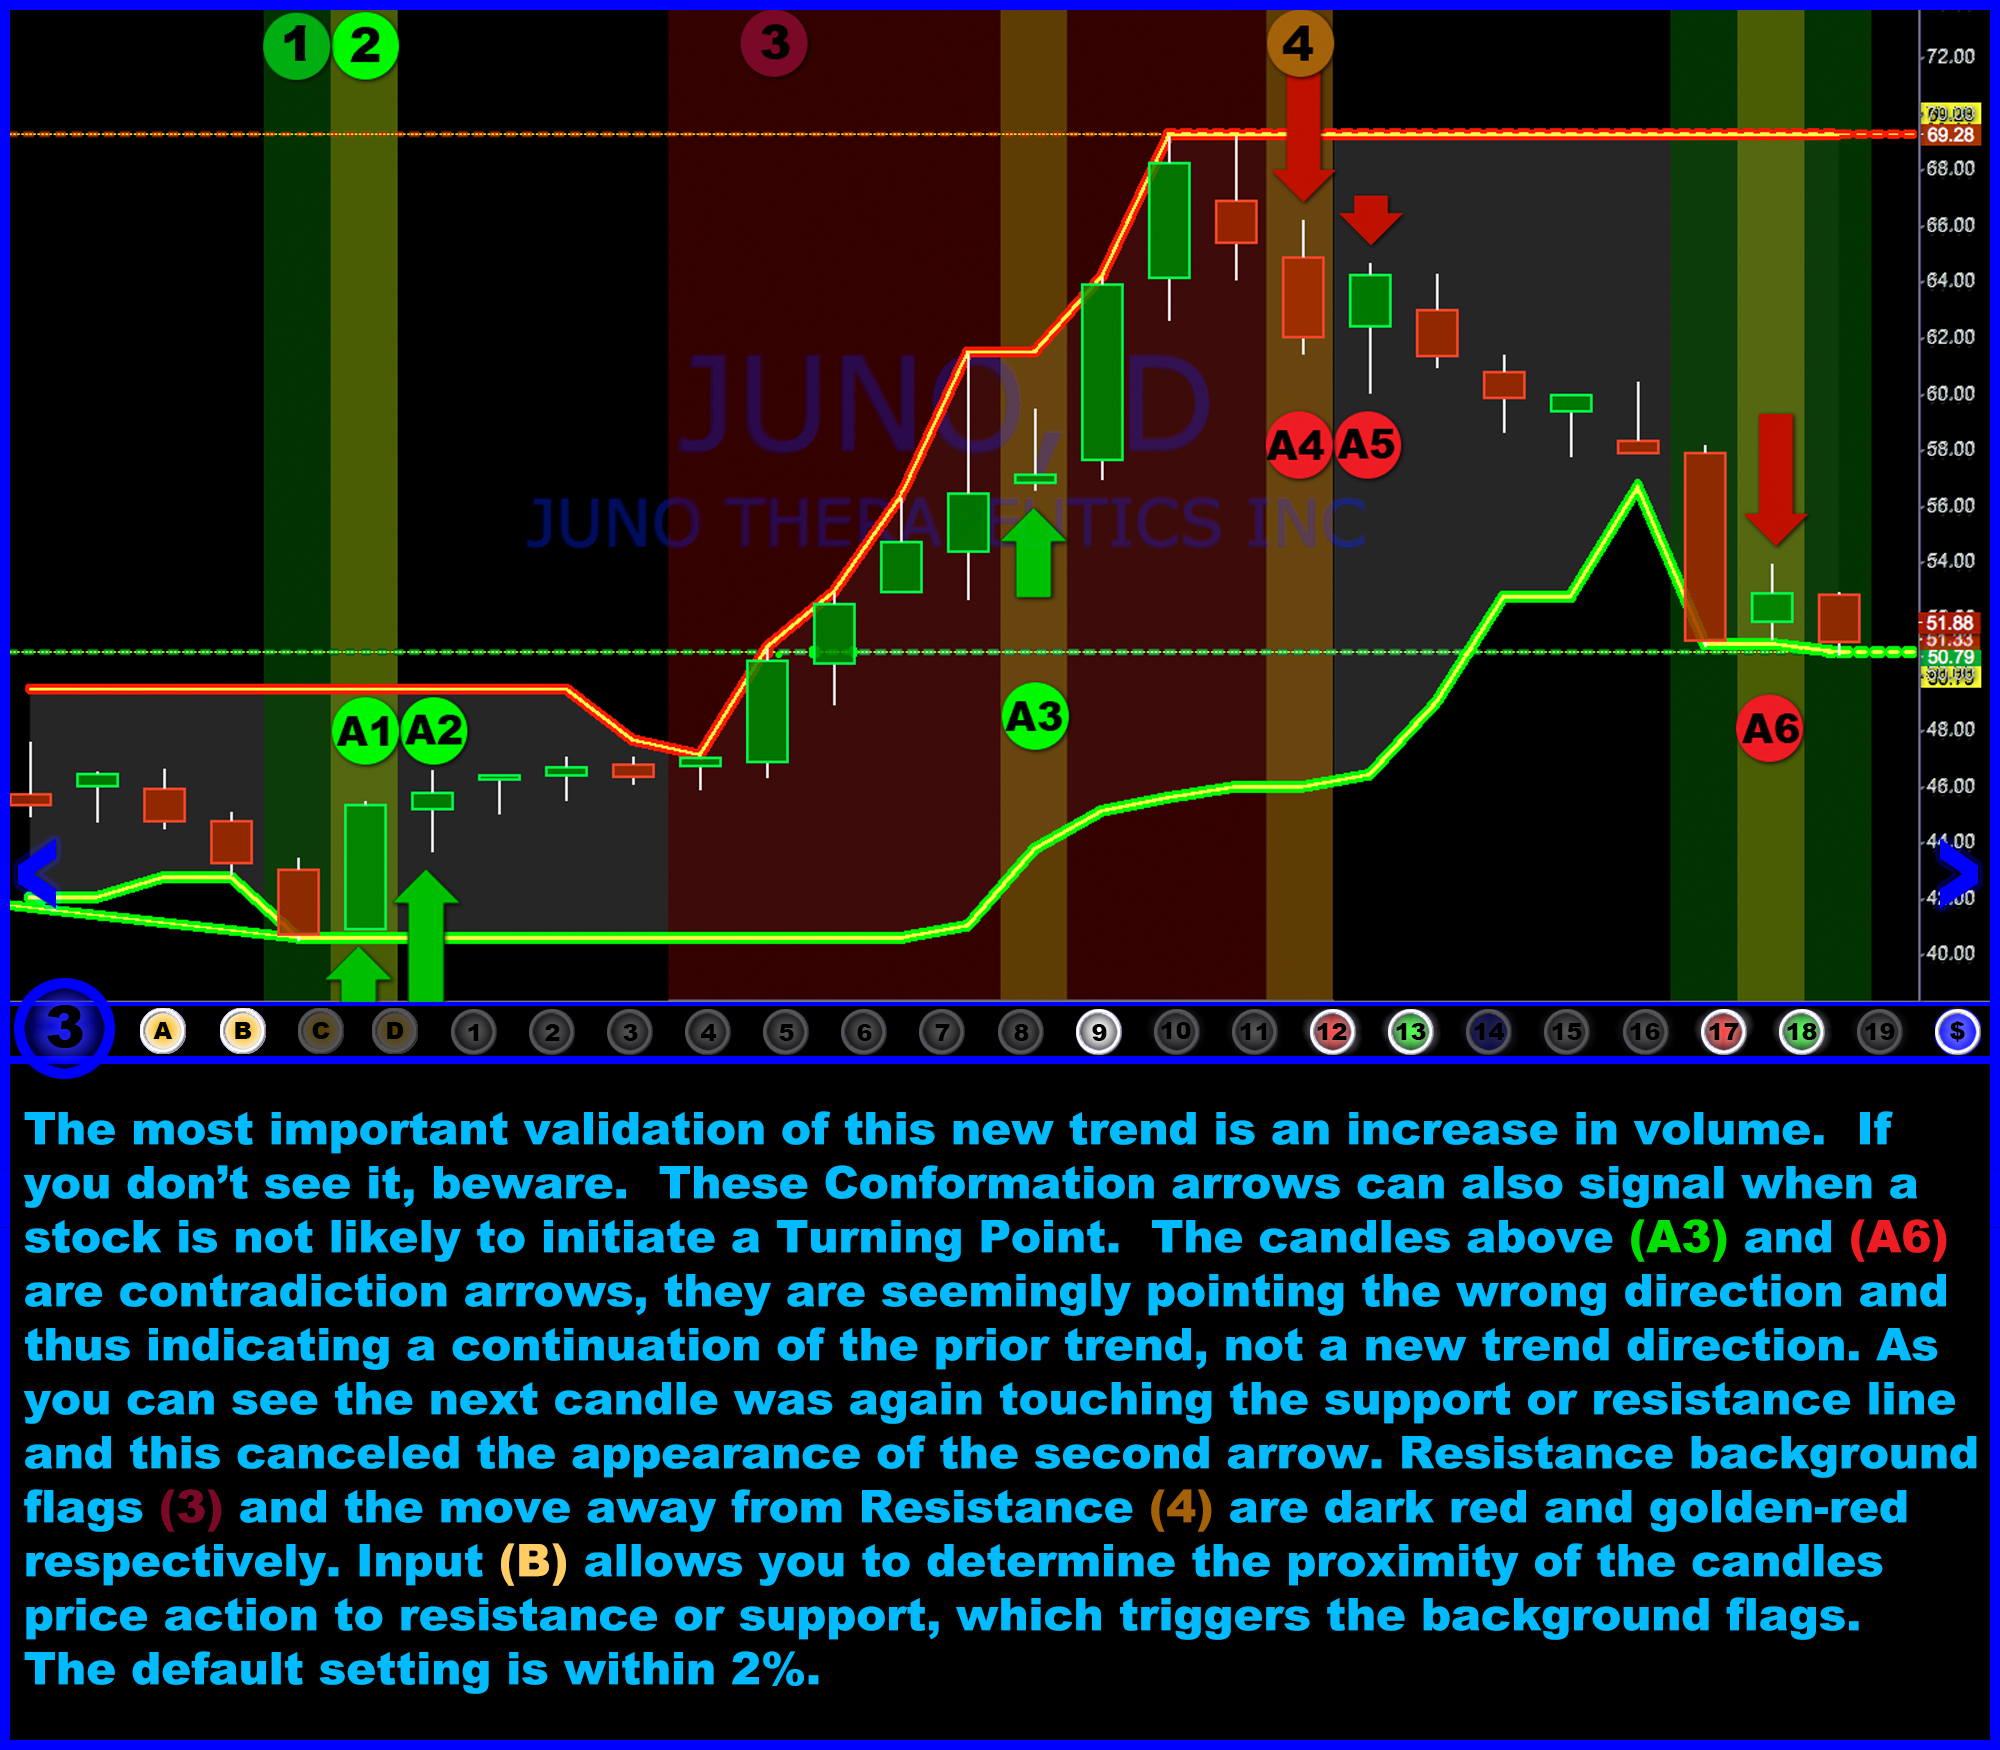
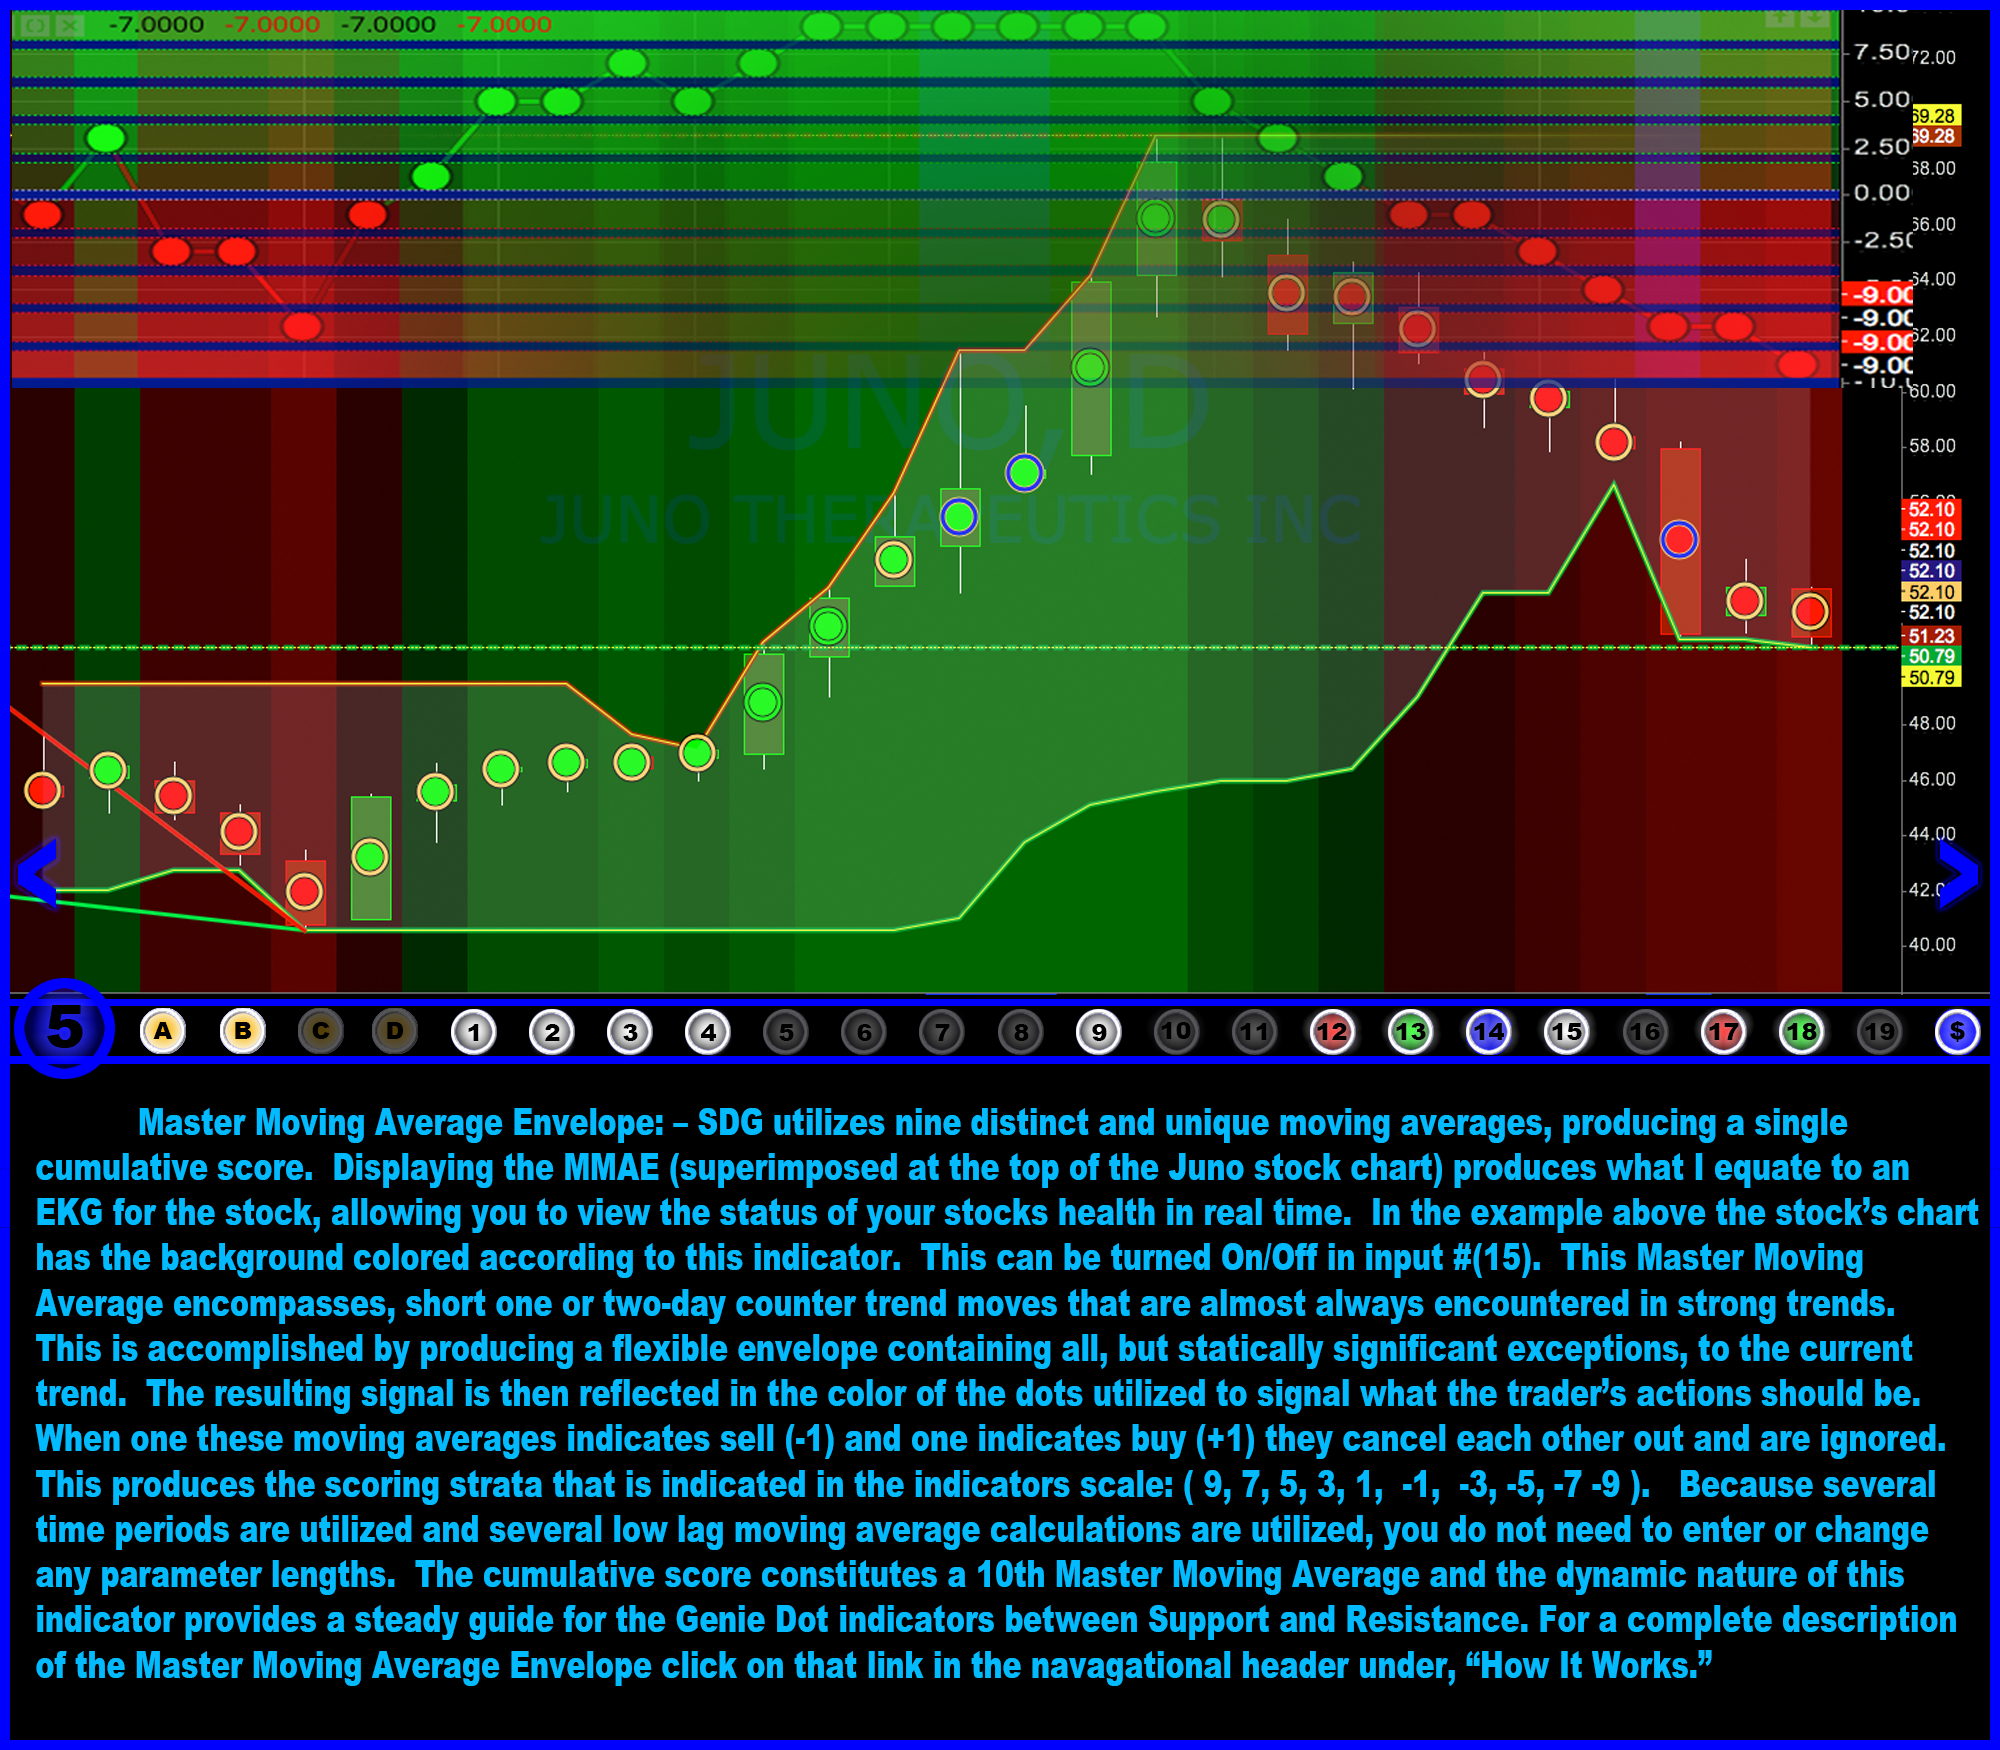
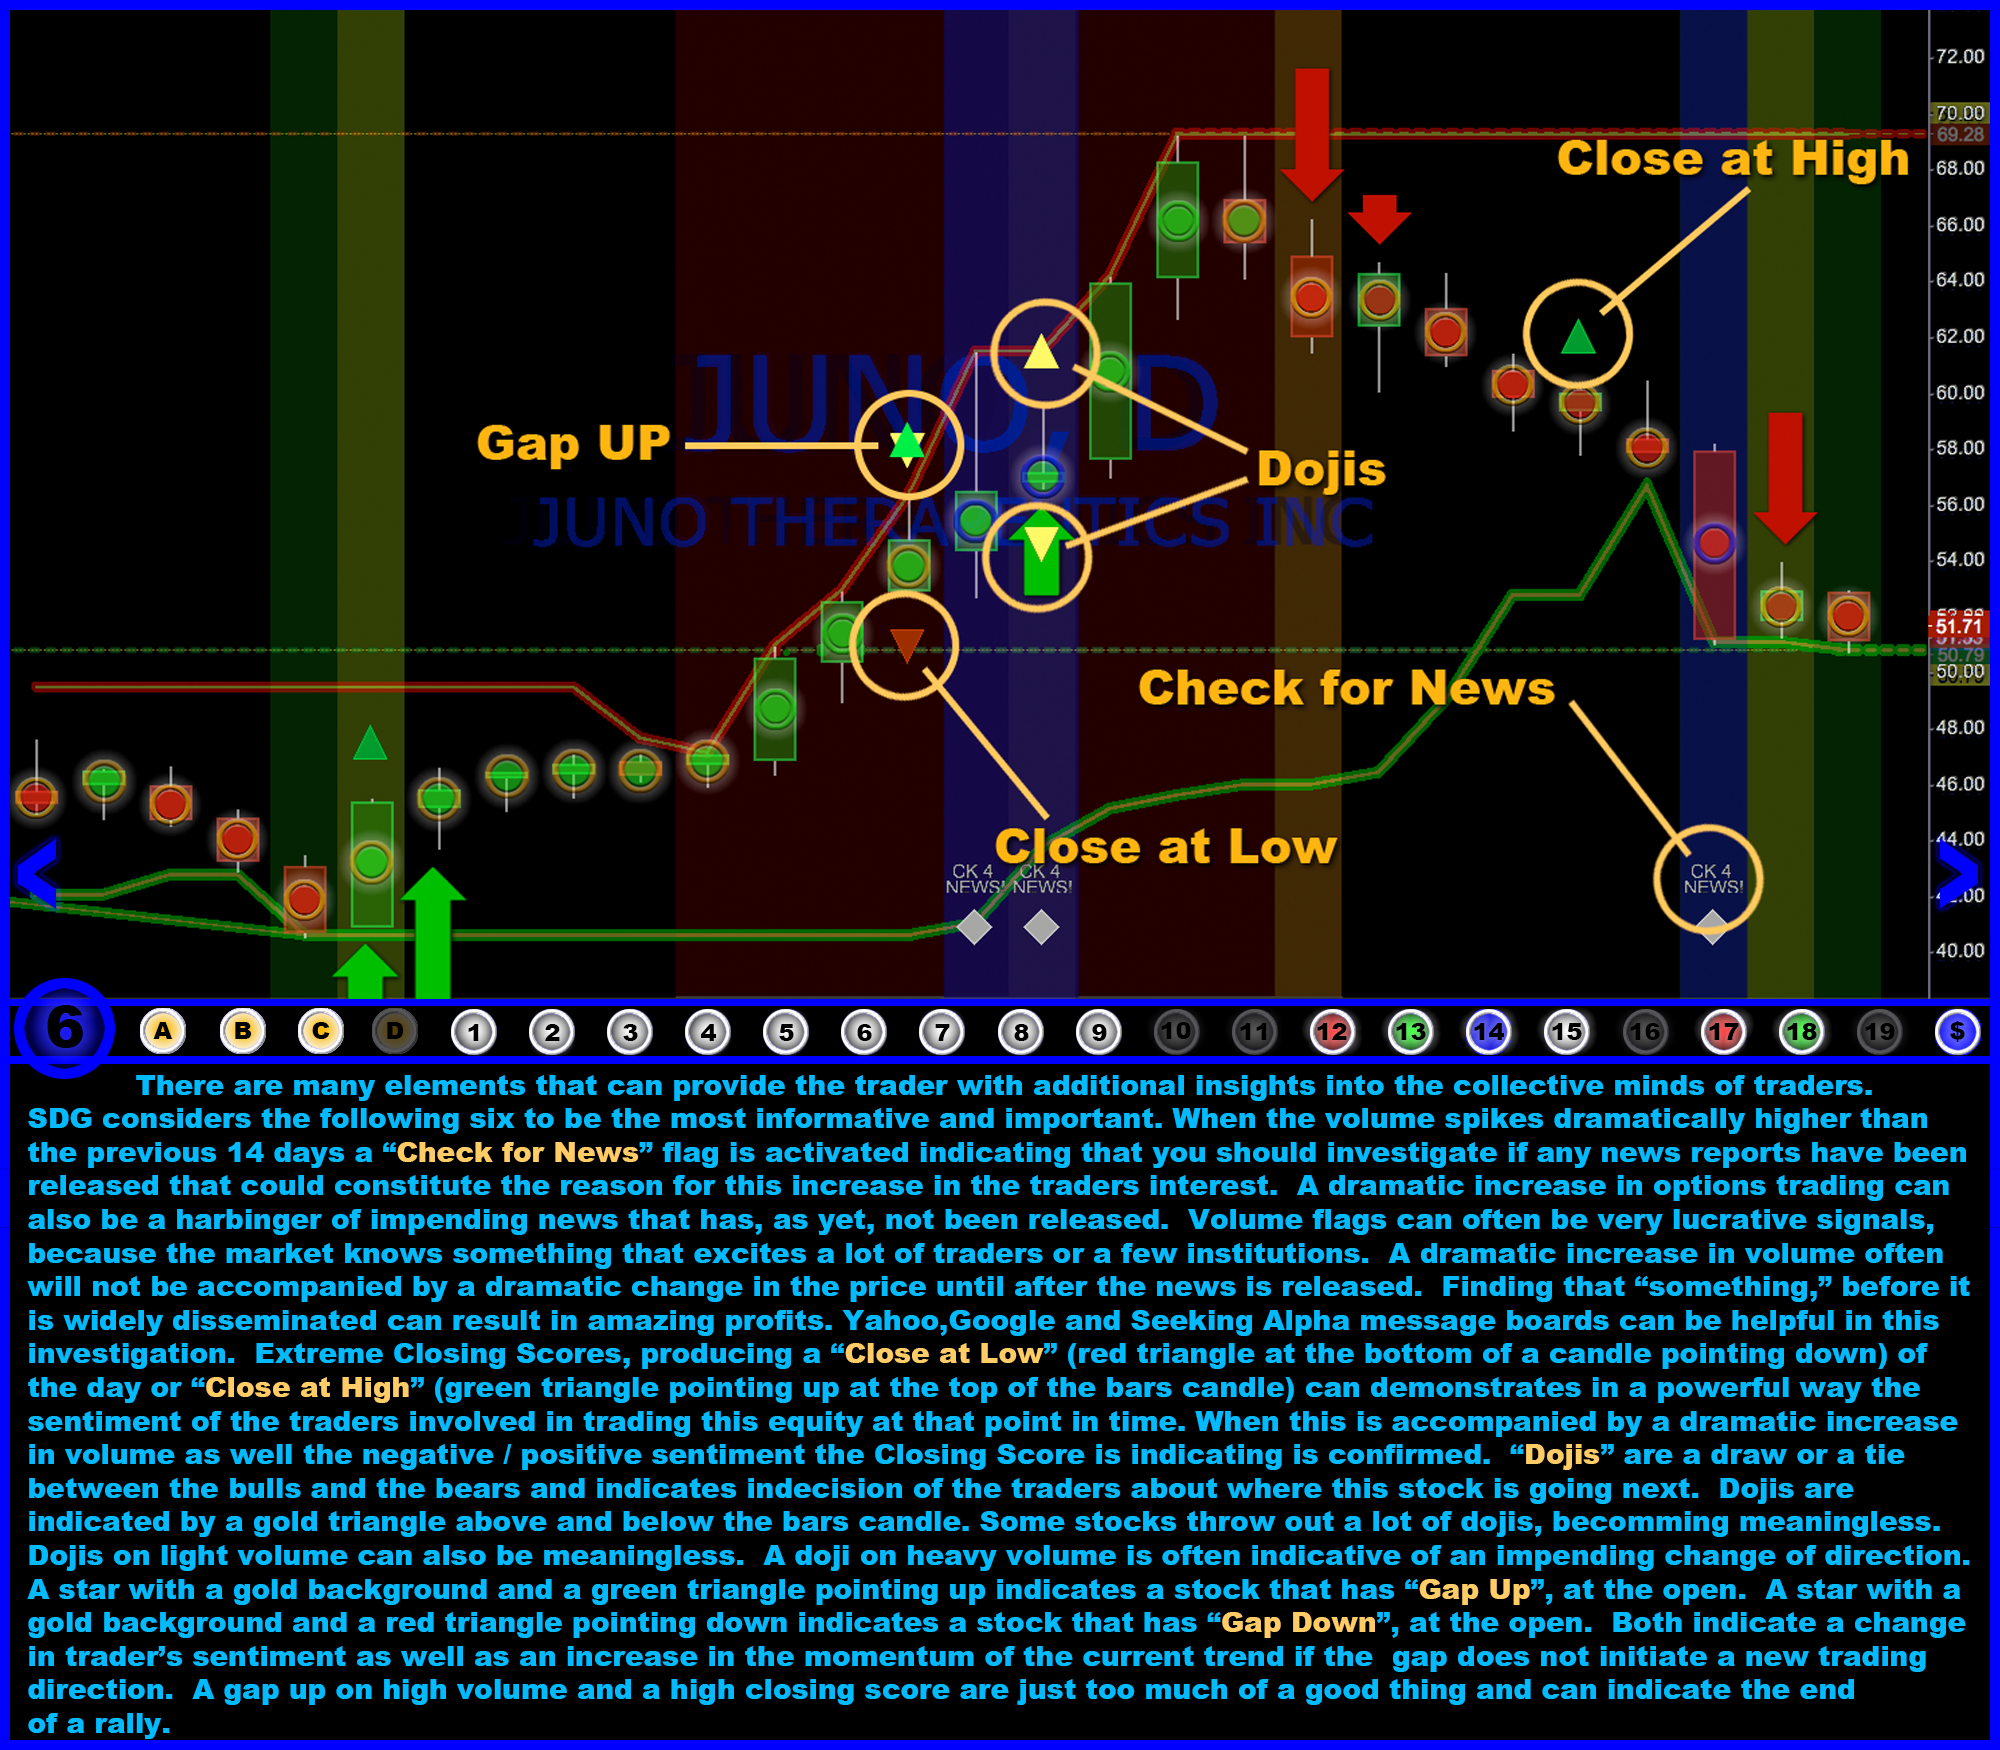
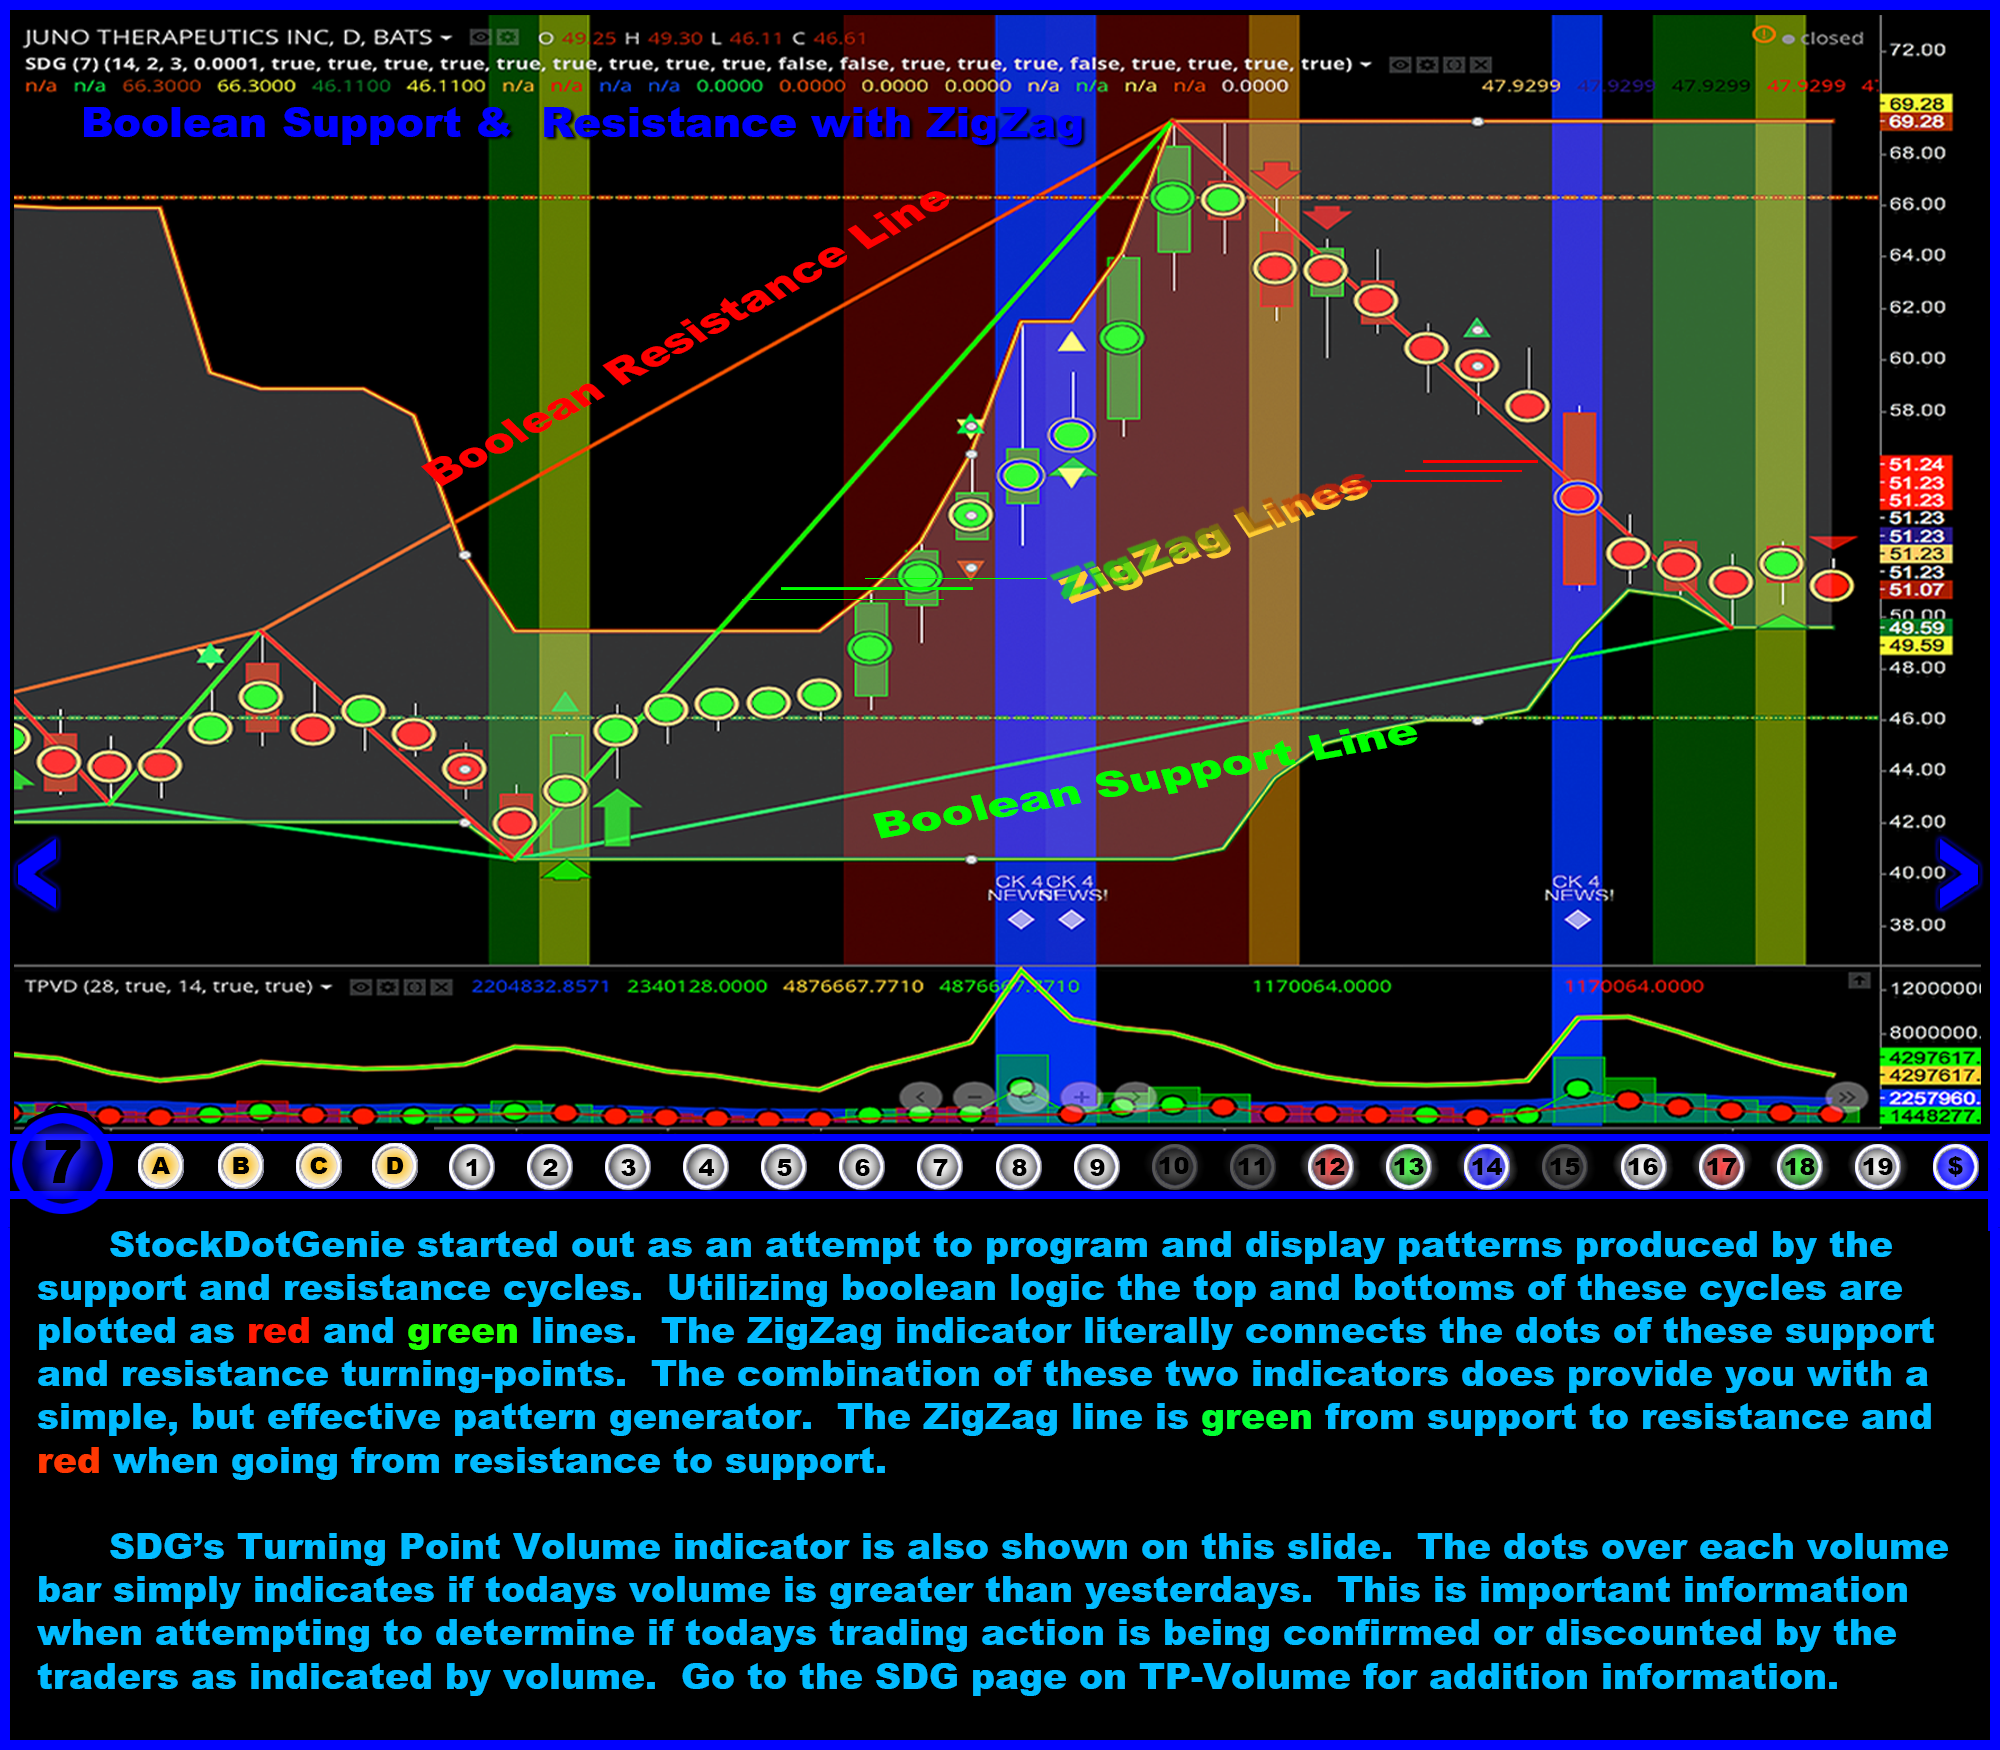
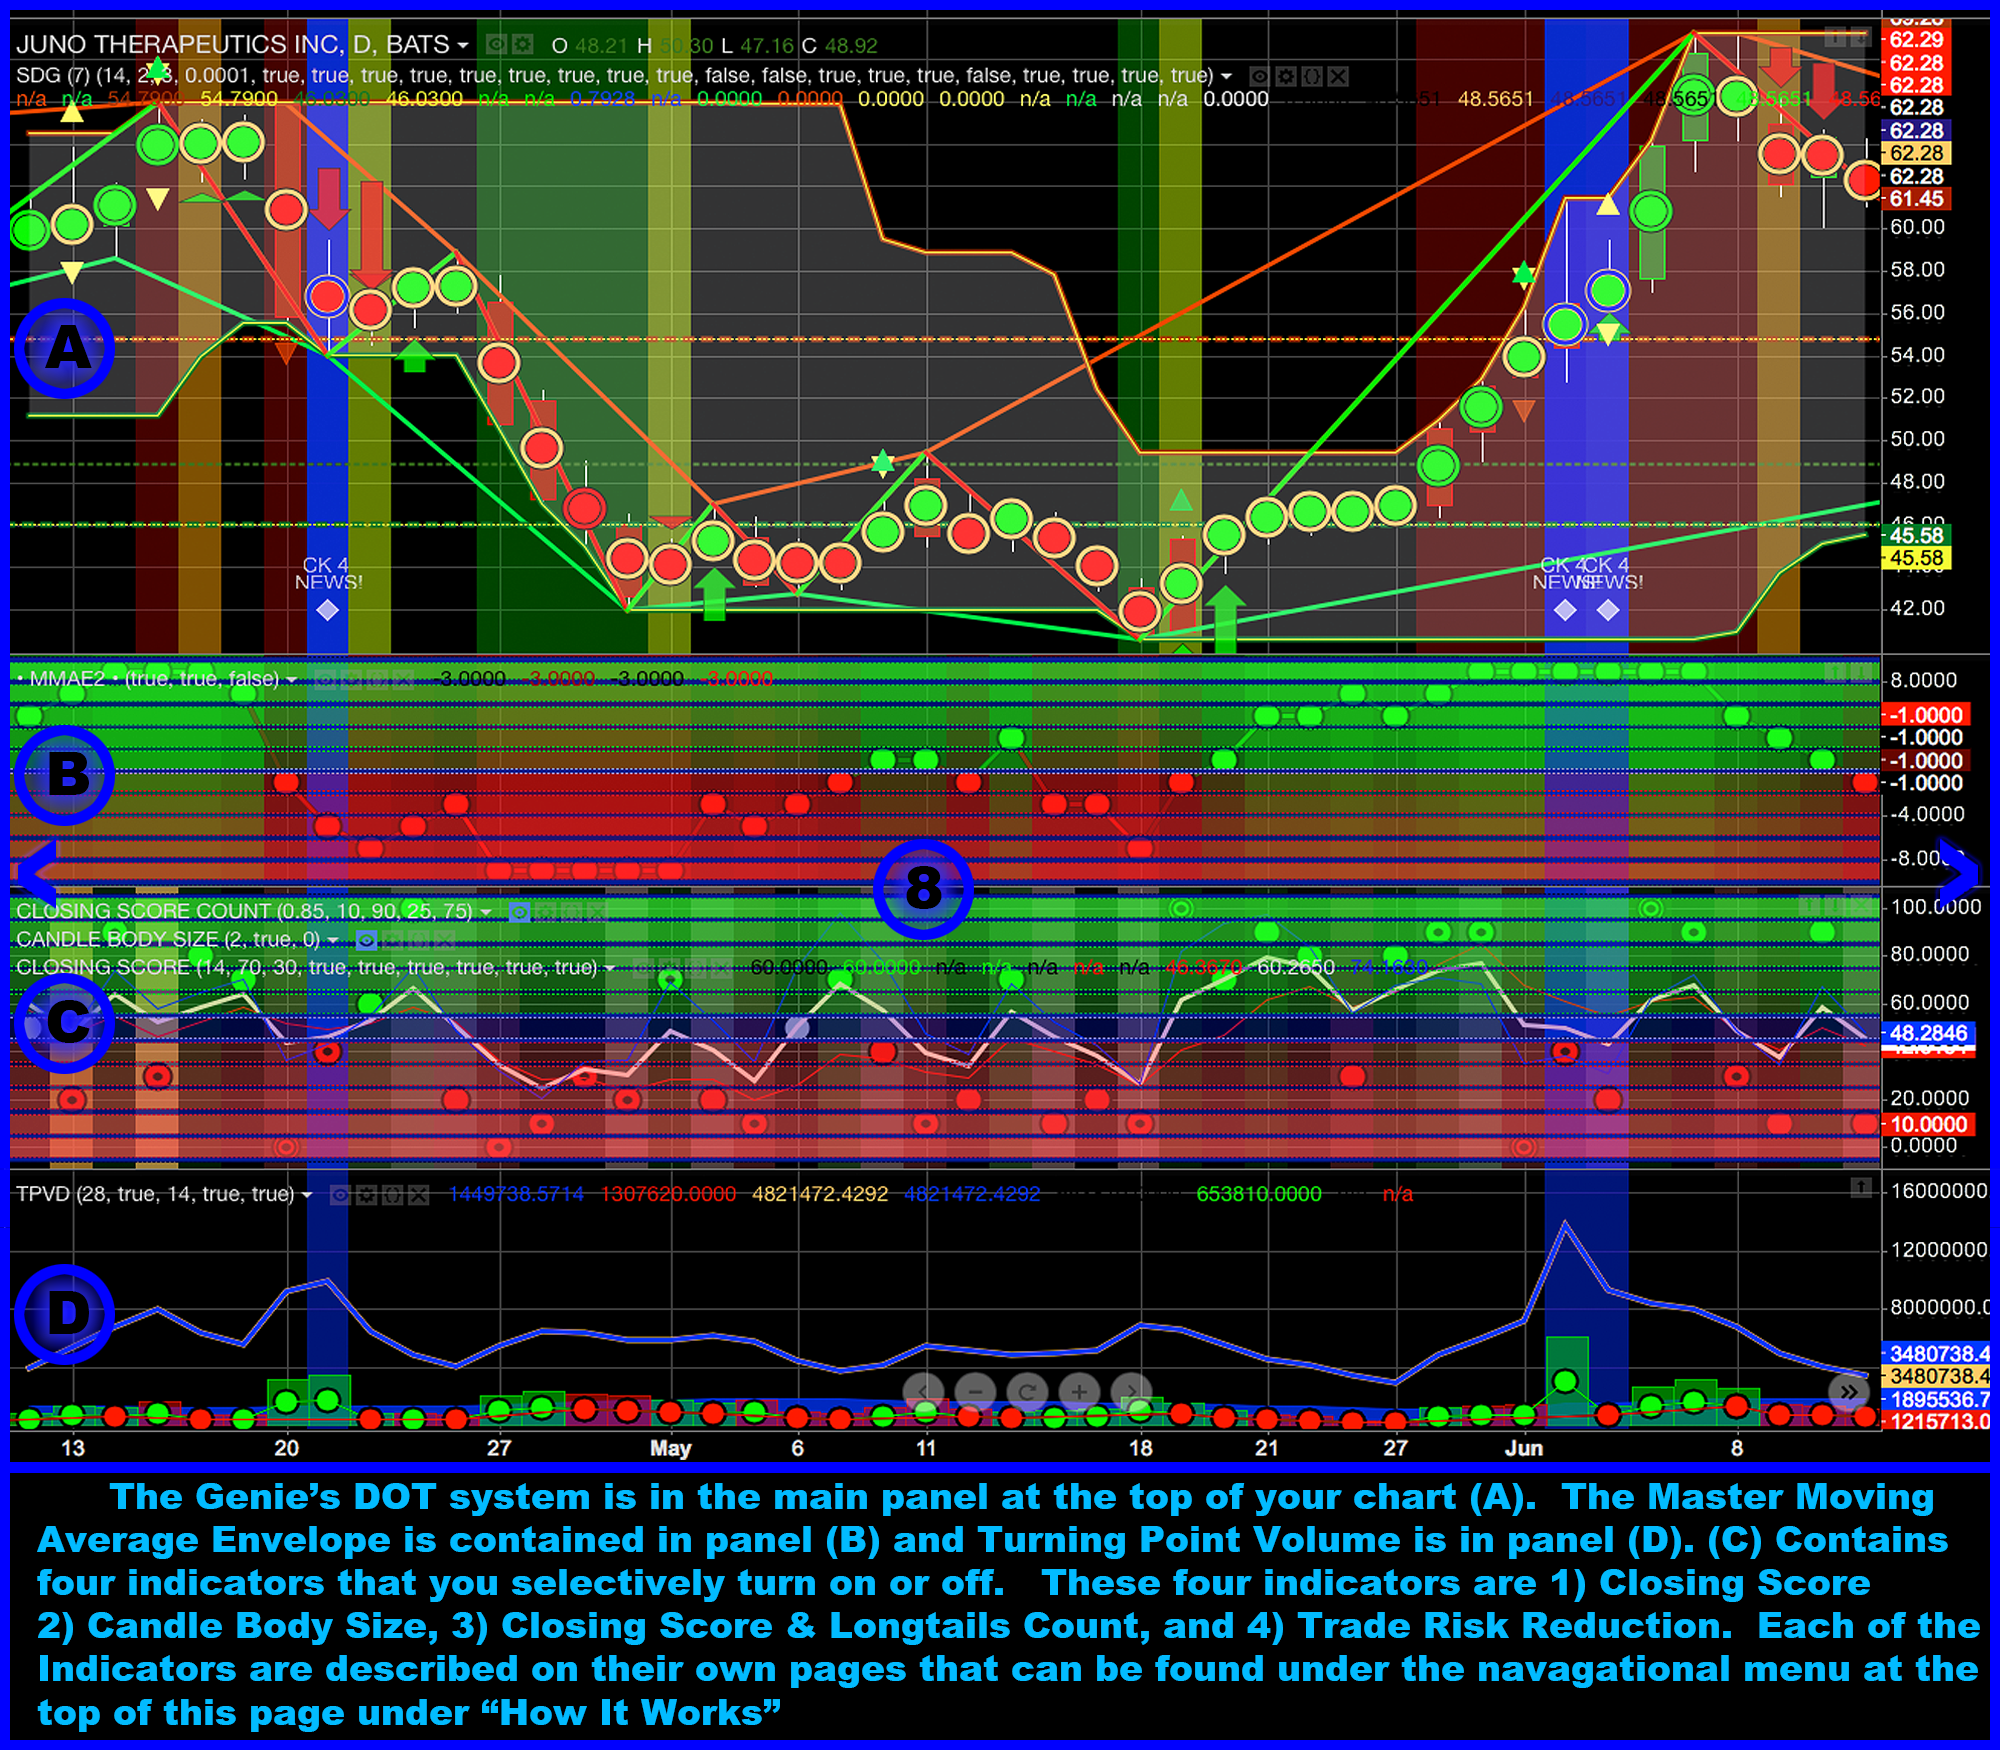
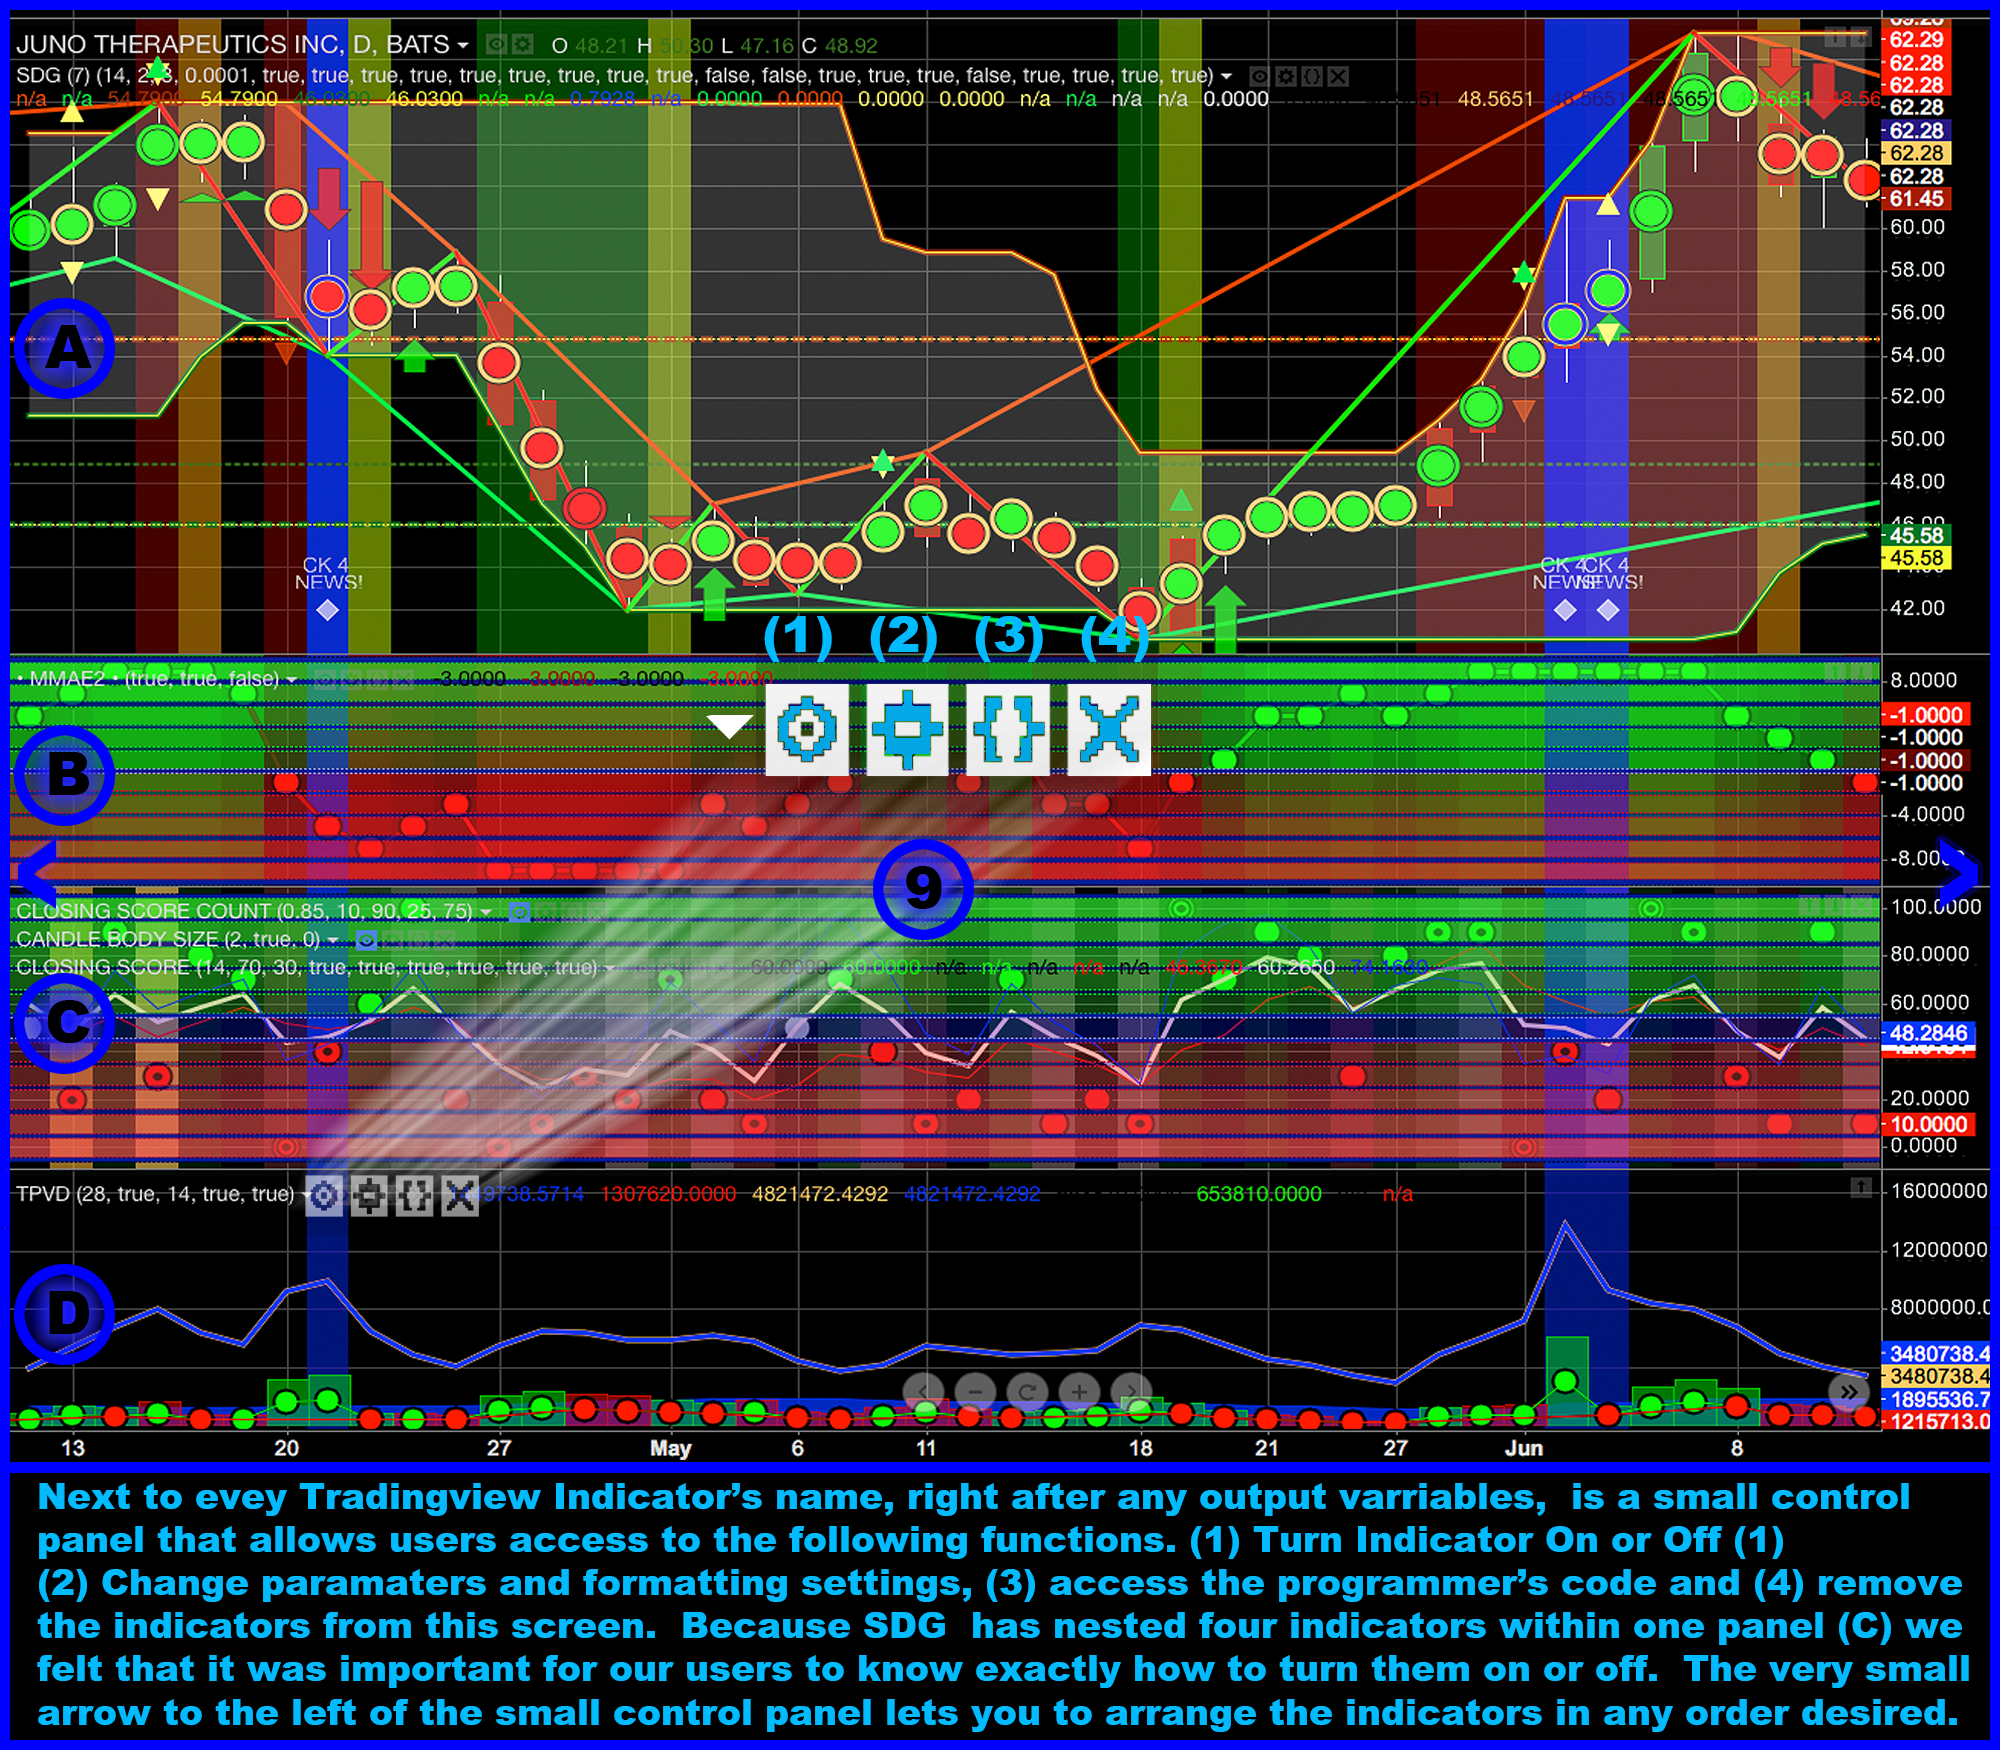
The Slides below will provide you with a quick introduction to SDG. Detailed information about SDG as well as each of it's unique indicators can be found on the linked instructional pages found in the navigation links in the header above. Look for"How It Works," at the top of this screen and drop that list down to choose.
A detailed explanation of how the dot's colors are applied and the calculations utilized are described at the bottom of this page.
At the center and far left or right of each slide are navigation icons that allow you to move through the program. Look for the blue and white "<" left and right ">" arrow icons to activate the next or previous slide.
For each indicator within SDG you have the ability to change the variable parameters (A through D) as well as determine what elements (1 - 19) of an indicator you choose to view. Below is the legend for the format palet for SDG. You can always return here to see the original settings.
The footer of every SDG page provides three navigational links. The red dot takes you to the previous page, the green dot take you to the next page and the Genie Lamp will take you to the SDG application on the Tradingview site. Contact information can be obtained by clicking on any of the Dots below the footer.
