

ACCESSING THE FORMAT PANEL &
FORMATTING YOUR INDICATORS is SIMPLE!

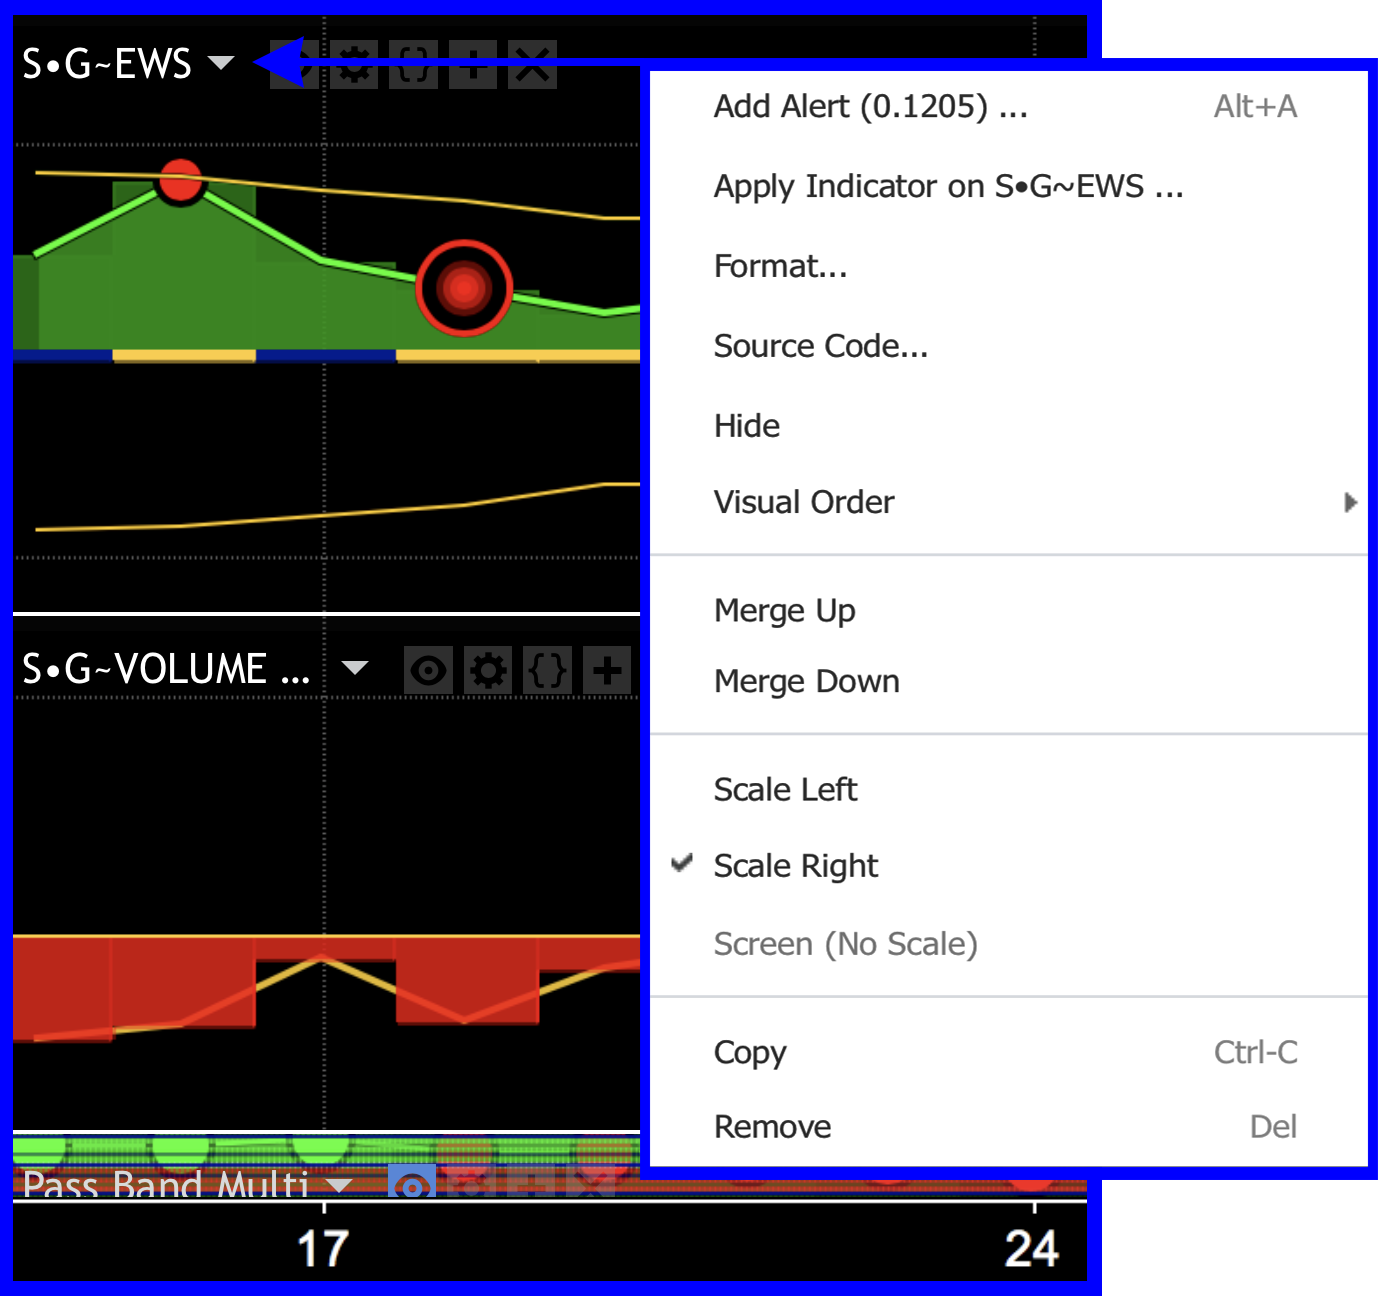
Next, to each indicators name, there are a series of small icons. See the enlarged icon map on the right.
(T) Triangle pointing down drops down the panel that allows you to arrange the indicators on your chart.
(1) Makes the indicator visible or invisible. Turning this indicator off does not remove it from your chart.
(2) opens the format panel for this indicator.
(3) In this example, the parentheses allow programmers access to their code. You probably will not be seeing this option.
(4) Allows you to add the current indicator to another indicator.
(5) Deletes (removes) the indicator from the current indicator pane.
SWING•GENIE CYCLES (TOP PANEL - OVERLAYS PRICE CHART)
Changing any indicator input values allows you to adjust your indicators to optimize them for changing market conditions and your trading style.
Many new users have encountered very complicated and crowded, sometime overlaping charts. Reducing the number of background flags or turning them all off will clear up your charts. Most of the background flags where intended to be utilized as needed and on a temporary basis. Using the merge and underage function can separate indicators so they each reside in a seperate indicator pane. See (T) above.
(1-4) ADJUST LOOKBACK LENGTHS FOR LAGUERRE FILTERS
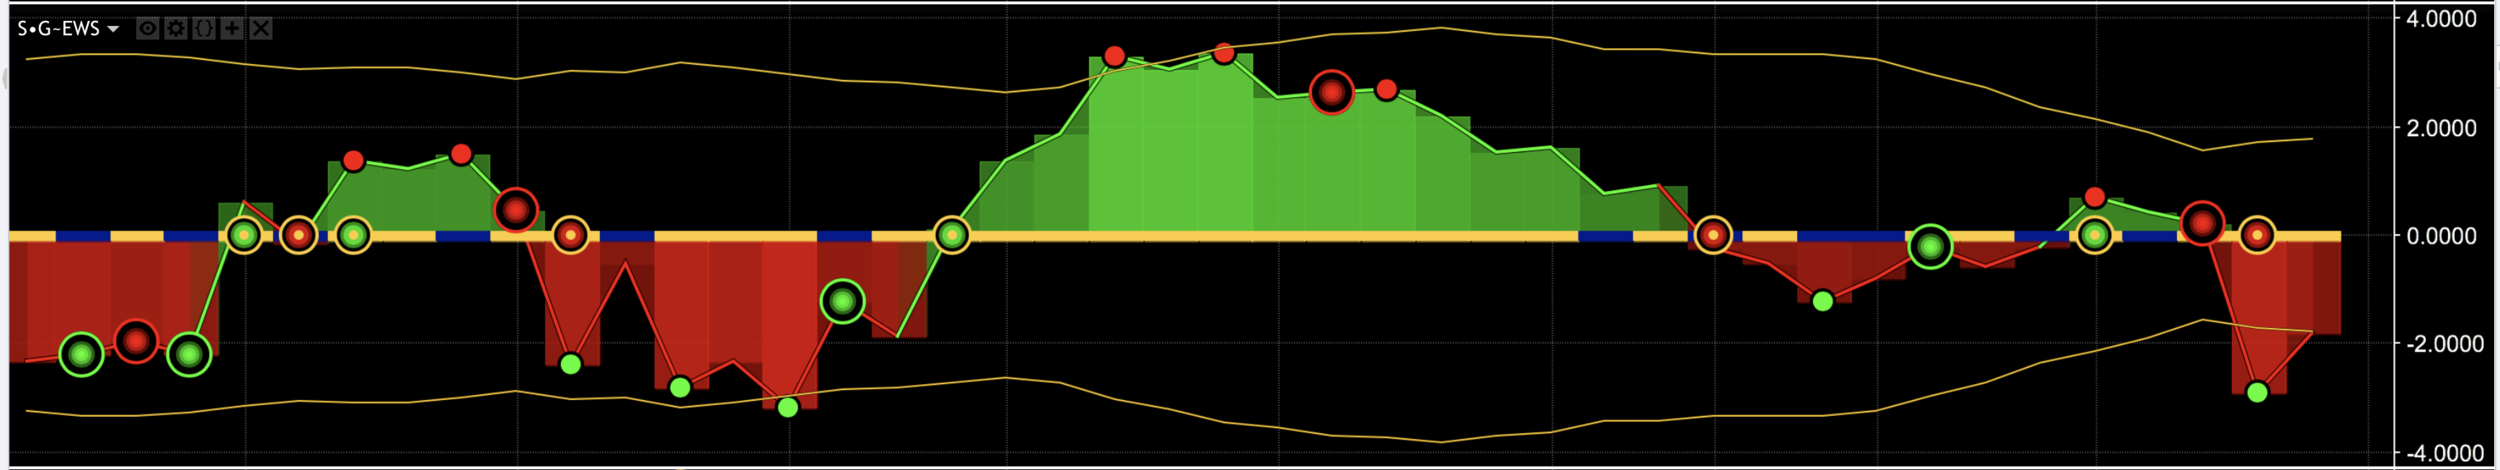
The Laguerre filters that produces the center moving average / filter and are then combined utilizing a passband filter. This produces one smoothed output that effectively removes the highest and lowest frequencies from the signal. The close of the day is then subtracted for the filter to produce the Early Warning System Columns.

•• Default settings: 1: [0.0], 2: [0.1], 3:[0.2], 4: [√ for On].
••• (4) This plot is affectd by changing the inputs for (1-3 gamma lengths)
••• Increasing these values will produce longer Laguerre moving filter lengths.
•••• References: Ehlers: TIME WARP – WITHOUT SPACE TRAVEL Laguerre filter
(5-7) SELECT AND DETERMINE CENTER OF GRAVITY (COG) LENGTHS
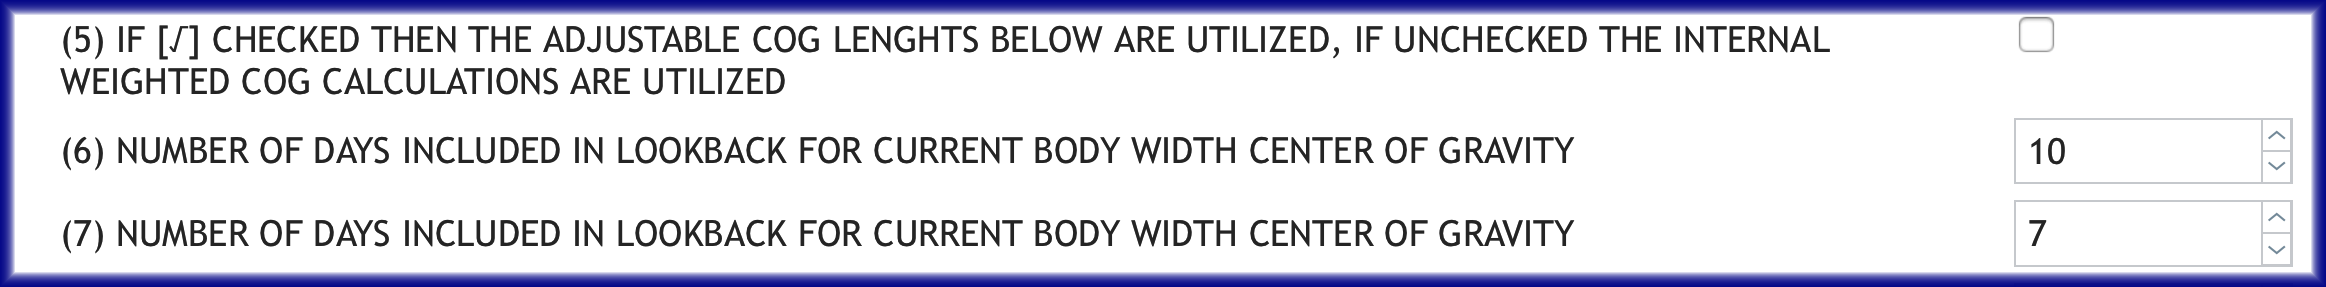
•• Default settings: 5: [not checked], 6: [10], 7:[6].
••• The shorter COG value is passed through the longer value [6-7]
••• This is then utilized as the input for the ALMA filter {next settings}
••• Selecting the custom settings option #(5) enables you to select longer period decreasing the number of buy sell signals.
•••• References: Ehlers: Center of Gravity
(8-10) ADJUST INPUTS FOR (ALMA) Arnaud Legoux Moving Average
(1) (2) (3)
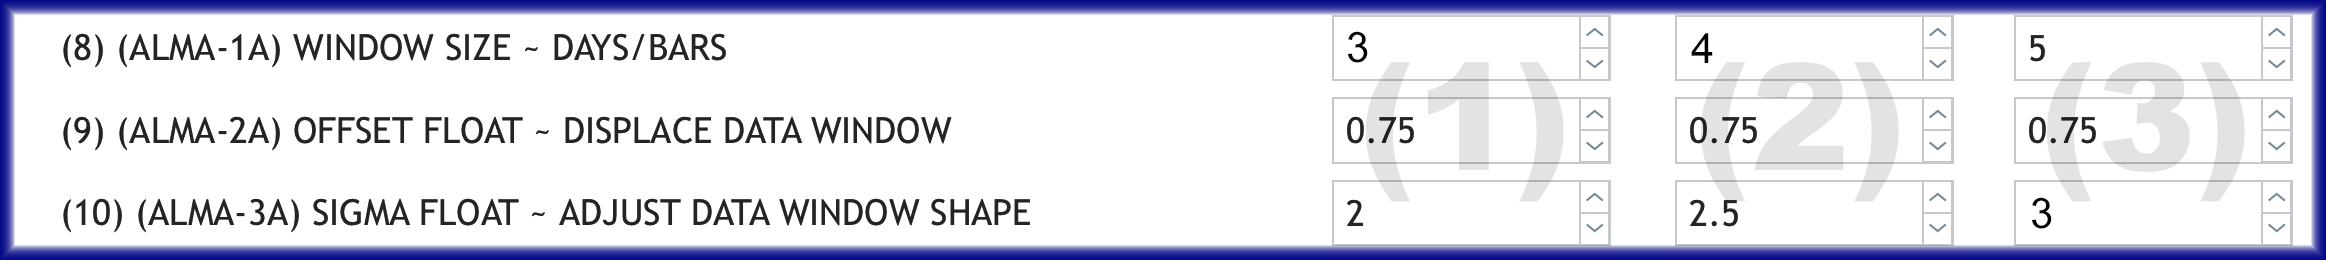
• Day Trading (1) Note: You can almost always gain small advantages
•• Swing Trading (2) by adjusting these settings depending on the equity
••• Hold Trading (3) and your trading style. Experiment and adjust.
(11 - 14) ADJUST PRIMARY BUY / SELL & ZIGZAG HIGHLIGHT LINES
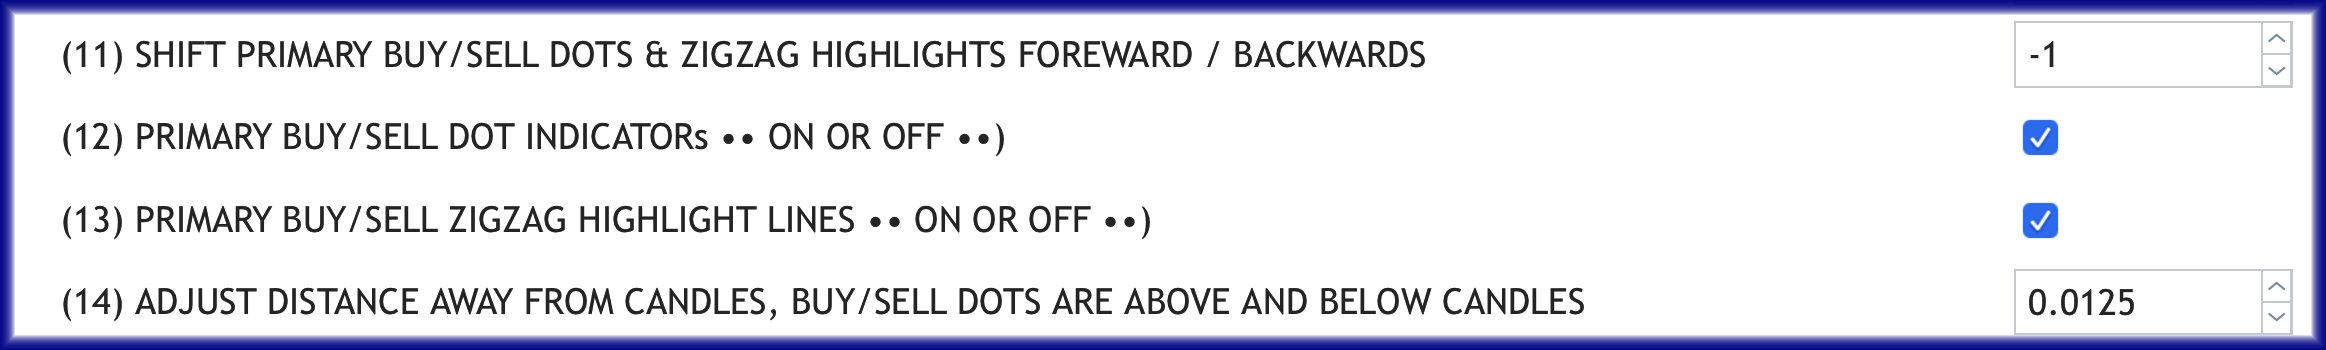
•• Default settings: 11: [-1], 12: [√ for On], 13:[√ for On], 14:[0.0125].
(15 & 16) X-LONG TERM - LAGUERRE MOVING FILTER LENGHT

•• Default settings: 15: [0.77], 16: [√ for On].
(17 & 18) DISPLAY & ADJUST SENTIMENT INDICATION FLAG

•• Default settings: 17: [0.3], 18: [√ for On].
•••• Reference: Closing Score Sentiment
(19 & 20) RATE OF CHANGE - CONSOLIDATION FLAGS

•• Default settings: 19: [0.3], 20: [√ for On].
(21) HIGH VOLUME ALERT BACKGROUND FLAG (BLUE / WHITE)

•• Default settings: 21: [√ for On].
(22 - 25) HURST - LAGUERRE CHANNELS / CYCLES

•• Default settings: 22: [√ for On], 23 [5], 24: [√ for On], 25 [20],
•••• Reference: HURST-LAGUERRE CHANNELS
(26 & 27) PROJECT HURST - LAGUERRE CHANNELS FORWARD

(28 & 29) PROFIT / LOSS LABELS & HIGHEST & LOWEST POINTS

ACCESS DEFAULTS AND RESET DEFAULTS

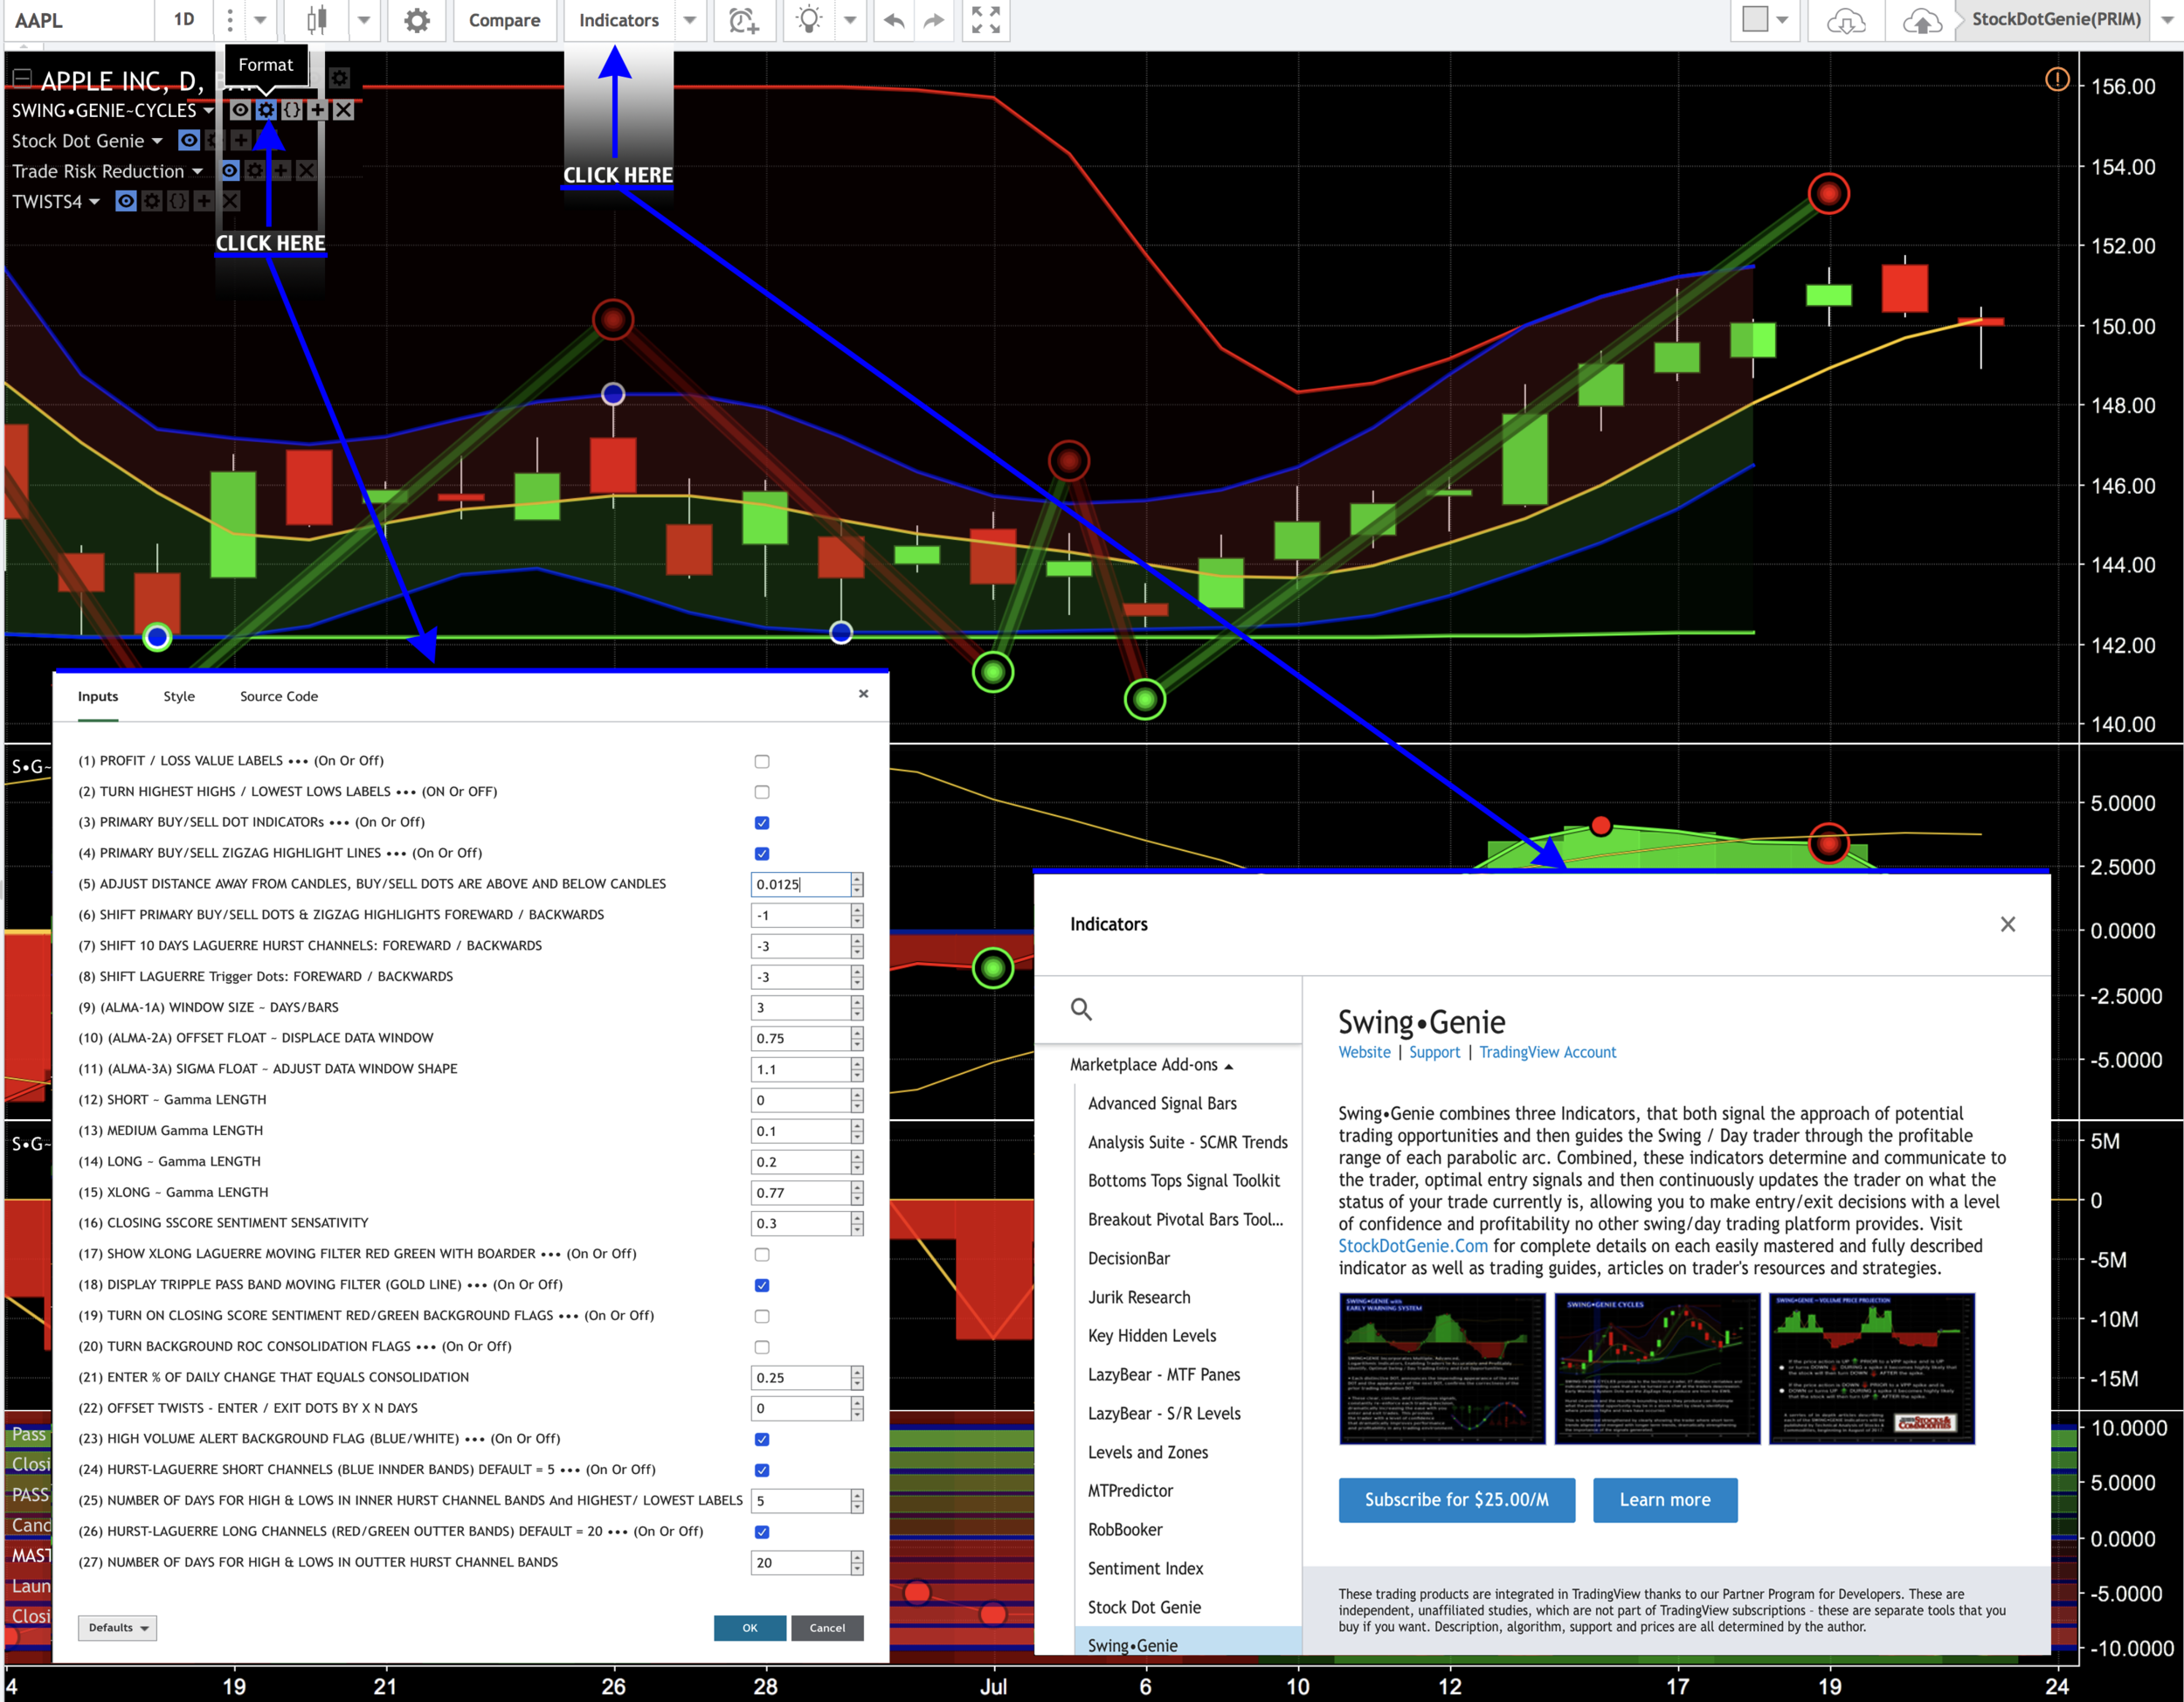
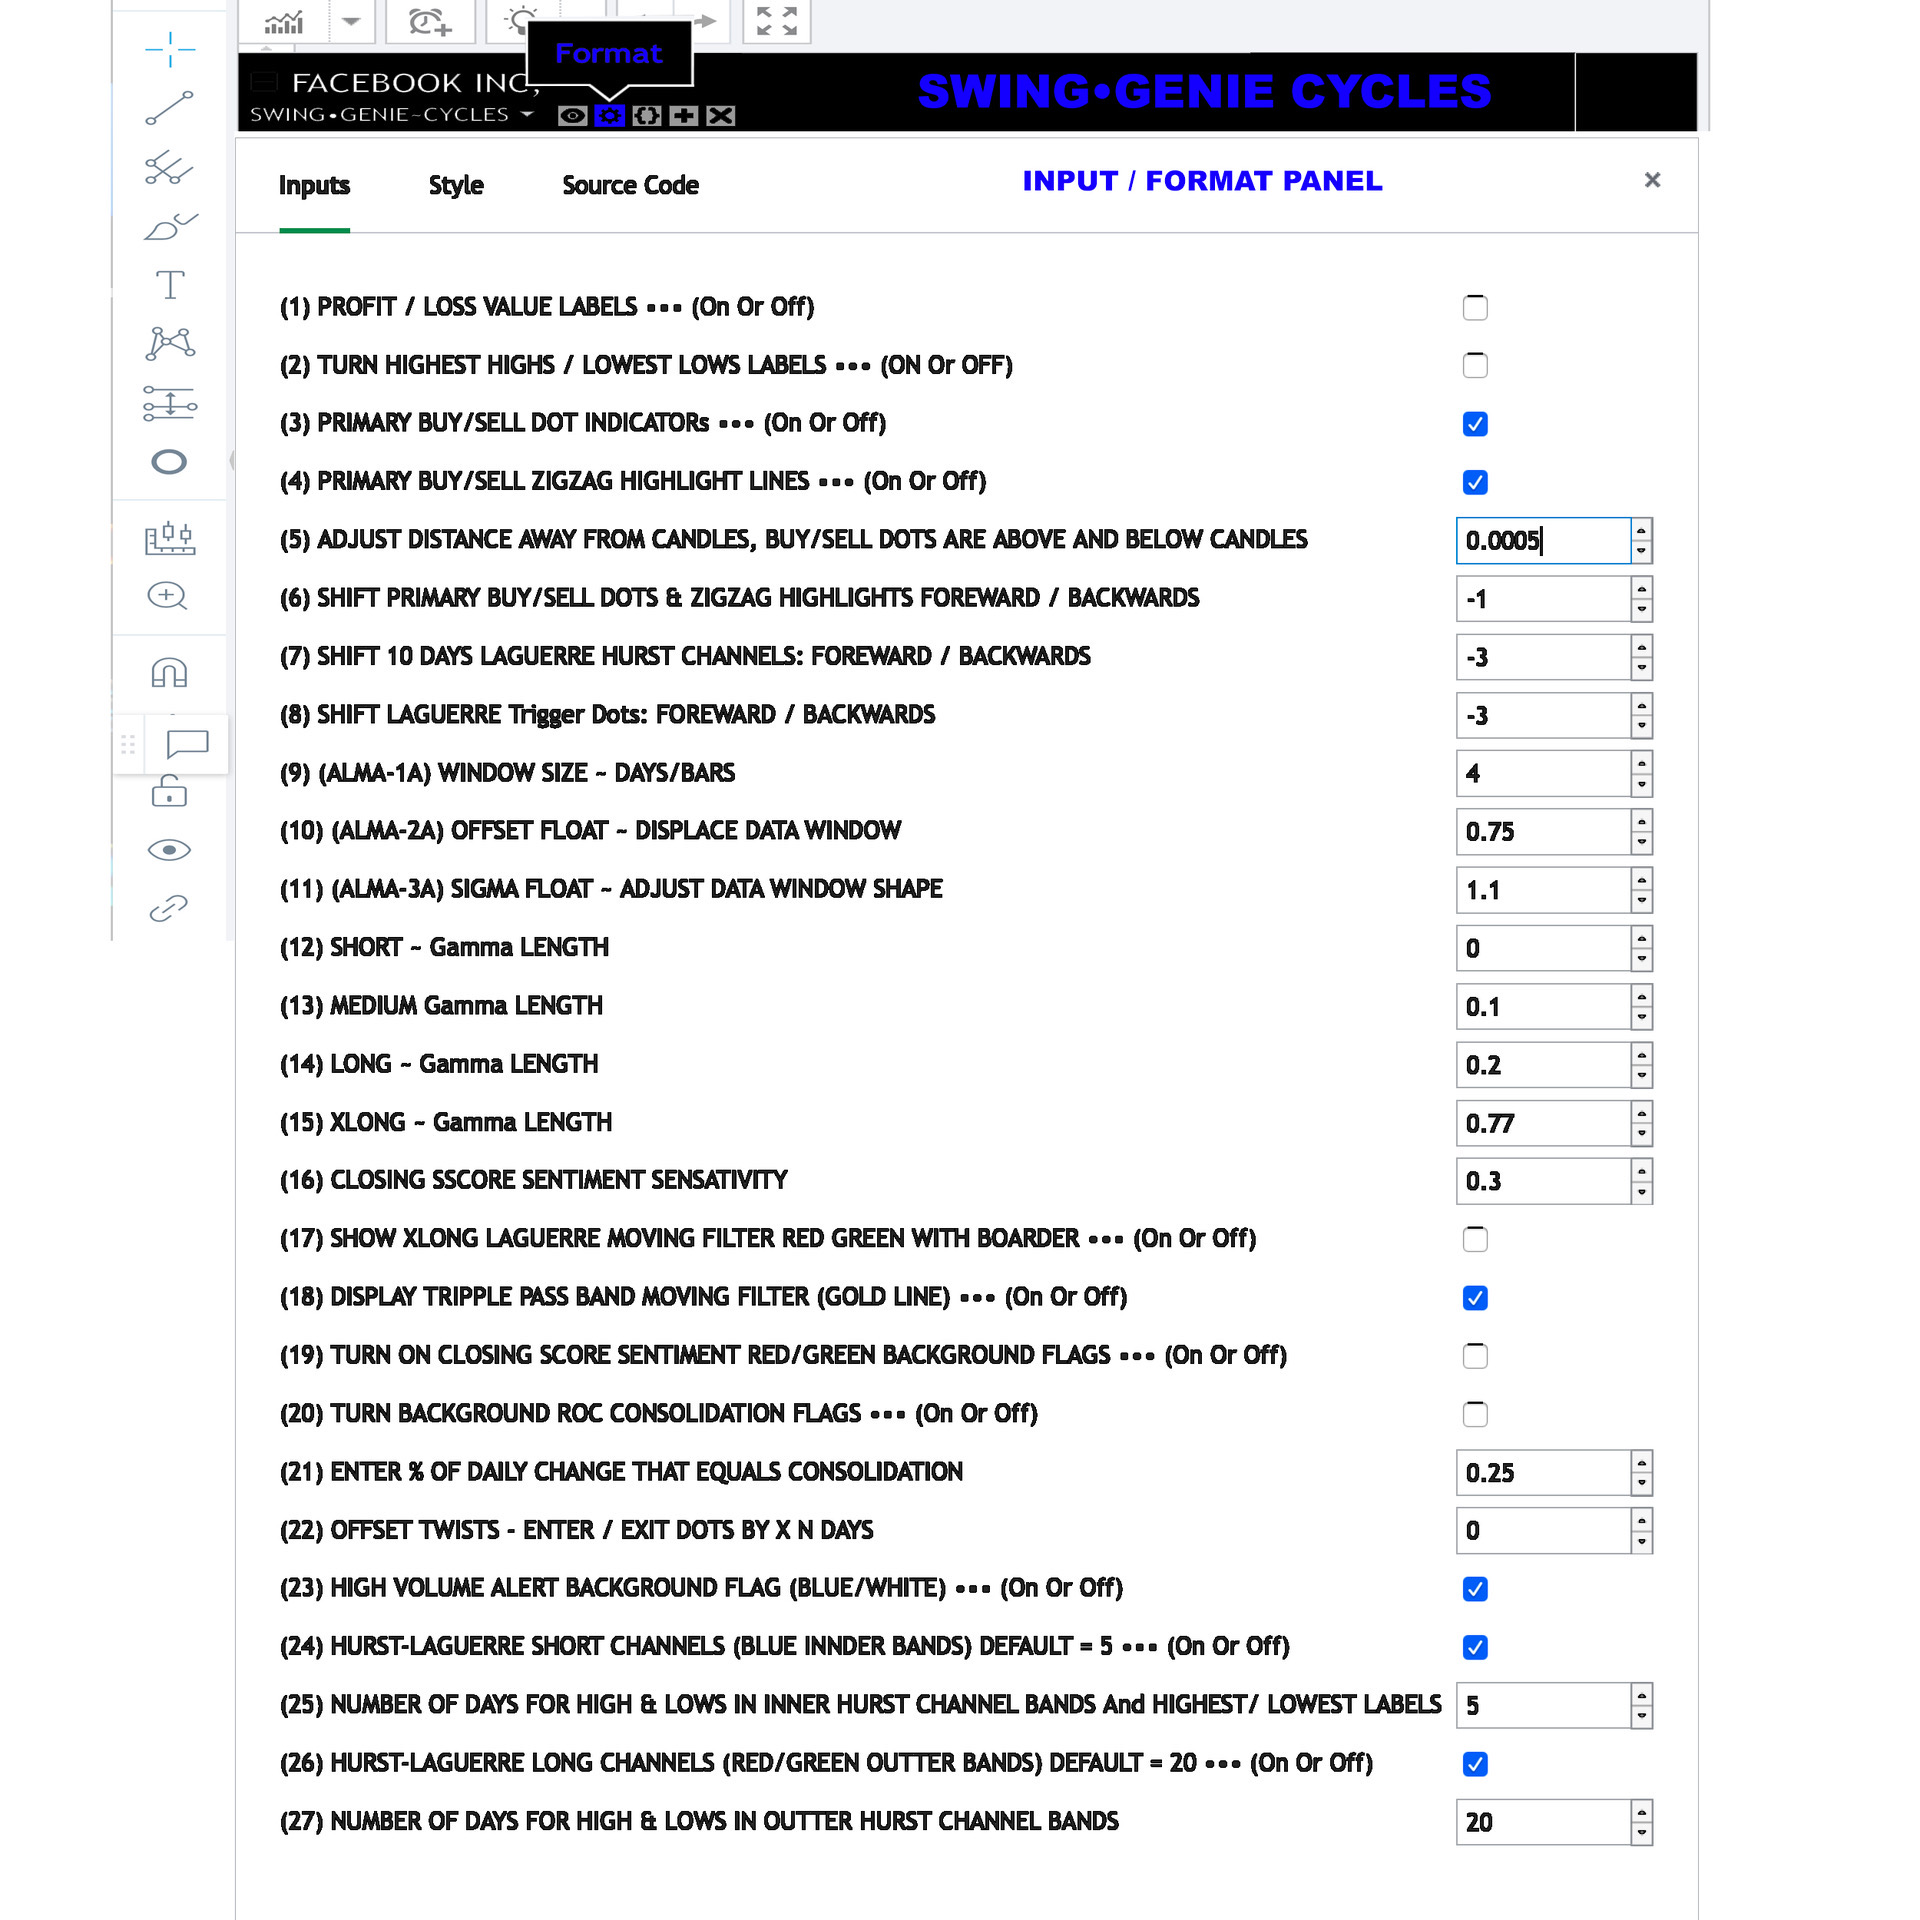
Below is a screenshot of the format panel for the SWING•GENIE Cycles indicator.
• ARRANGING INDICATORS ON YOUR CHART -
MERGING AND UNMERGING •
It is very easy to arrange your indicators on your Tradingview charts.
Click on the small triangle next to your indicator's name. This will drop down a menu that allows the user to 1) Move Up the indicator into the next indicator panel above. 2) Move Down the indicator into the next indicator panel below. Both of these options produce new trading indicator panels so that they will exist in their own indicator panel. 3) Merge Up and 4) Merge Down moves the current indicator into the panel with other indicators. You then use the format icons next to your indicator name to selectively turn them on or off. These are described in the Formatting You Indicators in the section above this one.
• TURN OFF THE CENTER CONSOLIDATION LINE FOR THE EARLY WARNING SYSTEM INDICATOR WHEN THE TIME FRAME YOU ARE VIEWING CHARTS IN IS LESS THAN 1 DAY •
Below are two examples of a chart with this consolidation line on. 1) is a daily chart of the symbol QQQ. 2) is a 15-minute chart of the same symbol. The center demarcation line when toggled on to indicated periods of consolidation can obscure critical information in your chart at any time frame below 1 DAY and you are better served by turning it off in shorter time frames.
There is also the option of turning on a background flags ((20) in the format panel) to indicate periods of consolidation. This is great when attempting to ascertain if your stock is within a period of consolidation and occurs at the apex or vertex of a parabolic swing.

• PROBLEMS A FEW OF OUR TRADER HAVE ENCOUNTERED •
The issues demonstrated below can all be resolved by reading the instruction at the beginning of this page. If you have any problems not resolved by these instructions please don't hesitate to use the contact link at the bottom of this page.


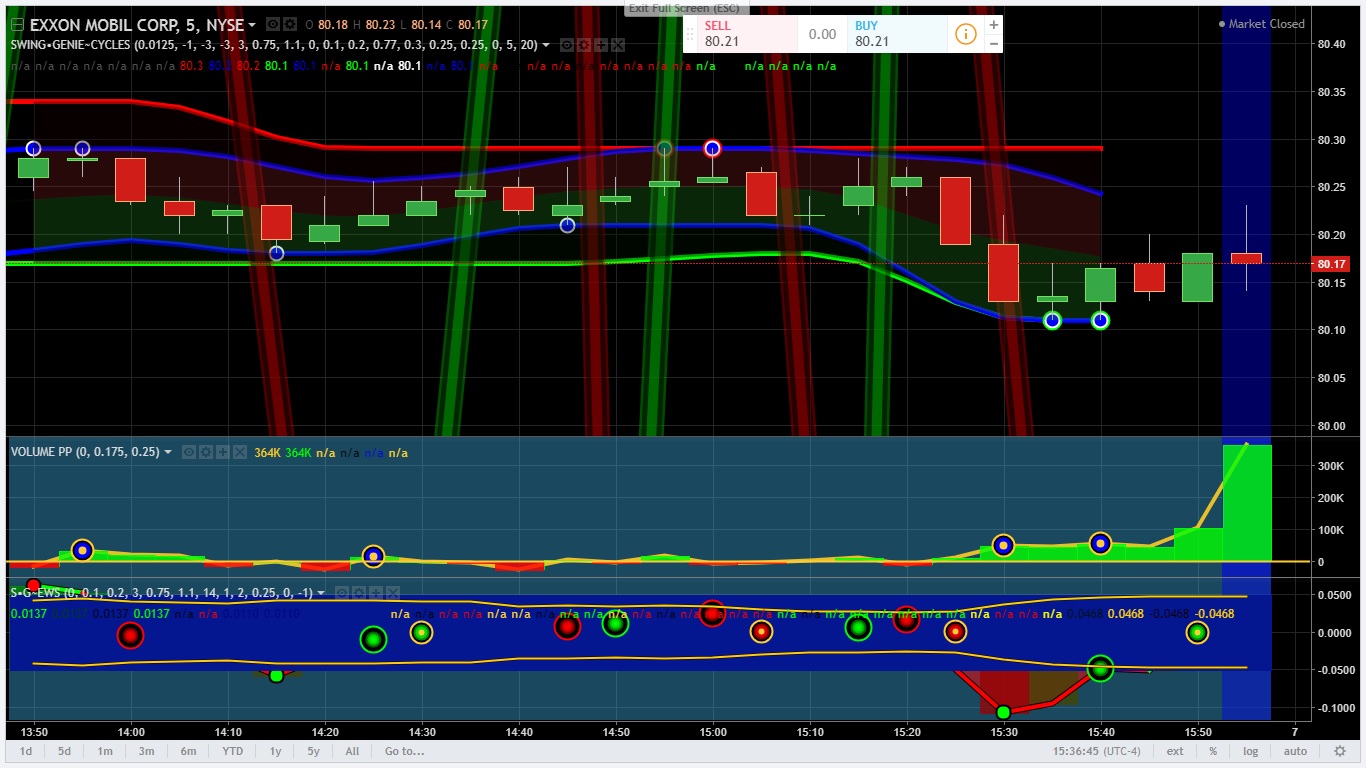
MY SWING•GENIE CHART SETUP
I have always utilized black backgrounds on my charts. I find that this configuration allows me to design color schemes that allow the focus to be entirely on the data being illustrated.

If you have any ideas or suggestion that you feel would improve either the indicators or how this instruction and formatting page could be improved please use the contact link below and share your insights with us. Thanks!


