


Trade Risk Management contains an Average True Range (ATR) indicator and a Risk Management Worksheet combined. This enables the trader to very quickly determine the level of volatility of any equity, allowing them to adjust their entry position size based on current and historical volatility. This is a simple and effective risk management tool. The trader only needs to enter the first three label values through the input/styles panel. Most traders will only need to do this once per trading session.
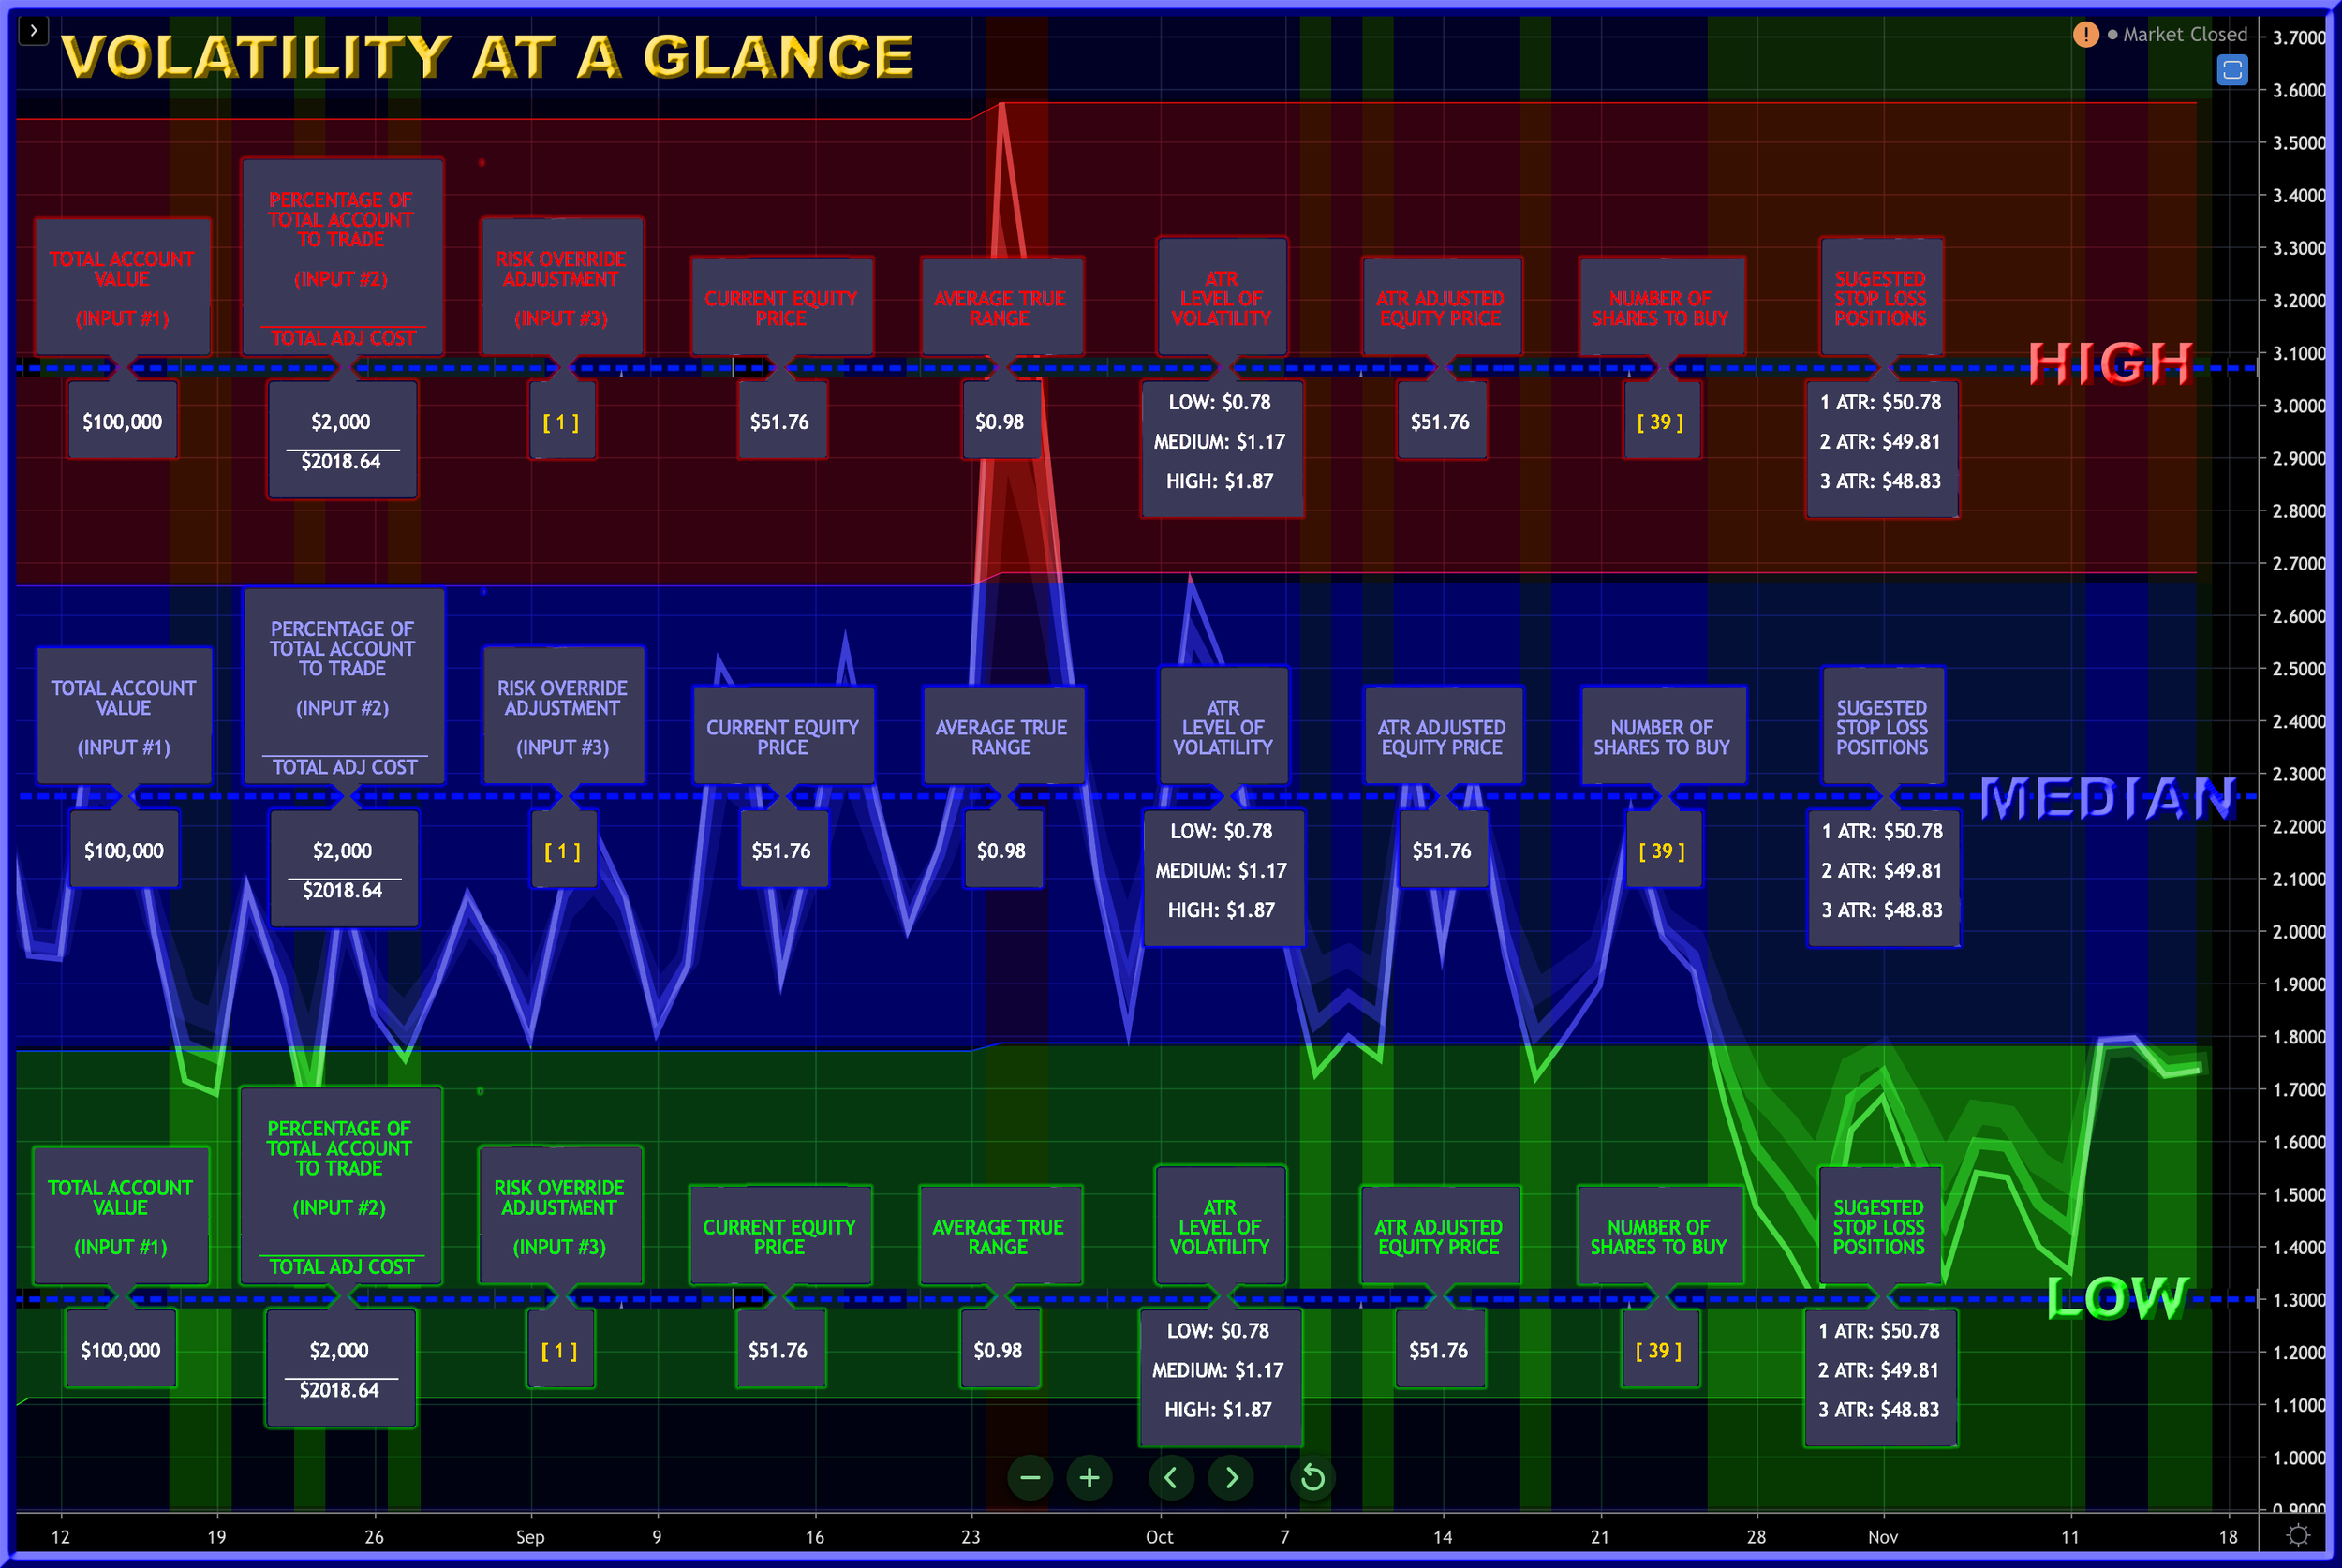
Historical Volatility is determined via a 60 day/bar look-back for the highest high and the lowest low of the ATR. These two figures are utilized to stratify three background bands (Red = High Volatility; Blue = Median Volatility; and Green = Low Volatility.) The labels are then plotted on the center-line value representing the historical volatility of the equity in question. The label color represents the current volatility of the equity.


This results in the trader only needing to glance at the indicator to obtain both a historical and current picture of the volatility of the equity in question. The center line will be plotted within the band representing the median volatility level for the last three months. The label text color is representative of the volatility currently being determined by the ATR.

The equity shown in the example above is displaying median historical volatile (blue background) and median current volatility (blue text). As such you can see that the current equity price [D] and the adjusted equity price (based on volatility level,) are the same.

If this chart is indicating high volatility (as in the example above) the adjusted equity price would be increased. This would result in your recommended number of shares to buy, being reduced. Low volatility decrease this adjusted equity price resulting in an increase in the number of shares this worksheet will recommend you buy.
In either case the adjustment is equal to the current value of the ATR. You can increase or decrease this using the Risk Override Adjustment input (C above).
LABELS: INPUTTED AND CALCULATED VALUES
LABELS INPUTTED BY TRADER
A. TOTAL ACCOUNT VALUE: The value of all equities and all cash held in you trading account.
B. PERCENTAGE OF TOTAL TRADING ACCOUNT TO TRADE: This is the primary point of risk management you have. Many professionals utilize 2% of their total assets to allocate to what they refer to as a Unit. The smaller the percentage you choose to risk of your total trading capital the less risk your account is being exposed to.
C. RISK OVERRIDE ADJUSTMENT: The Risk Override Adjustment allows you to manually increase or decrease the number of shares you are considering purchasing. This adjustment also changes the Stop Loss settings. You are simply multiply the current ATR values when you change this setting.
LABELS CALCULATED BY INDICATOR


