


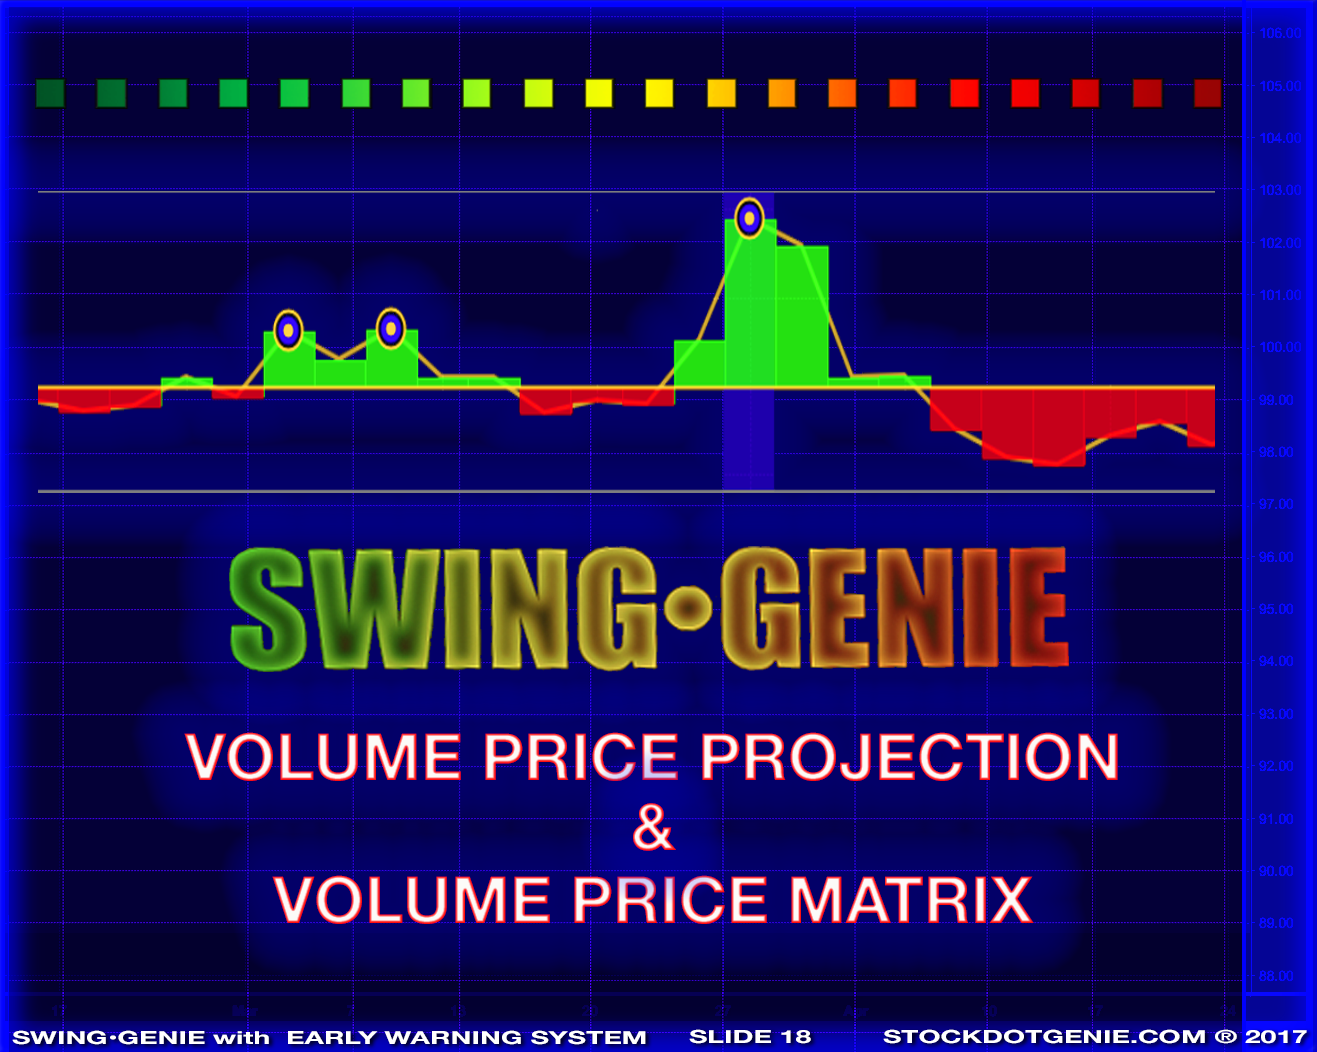
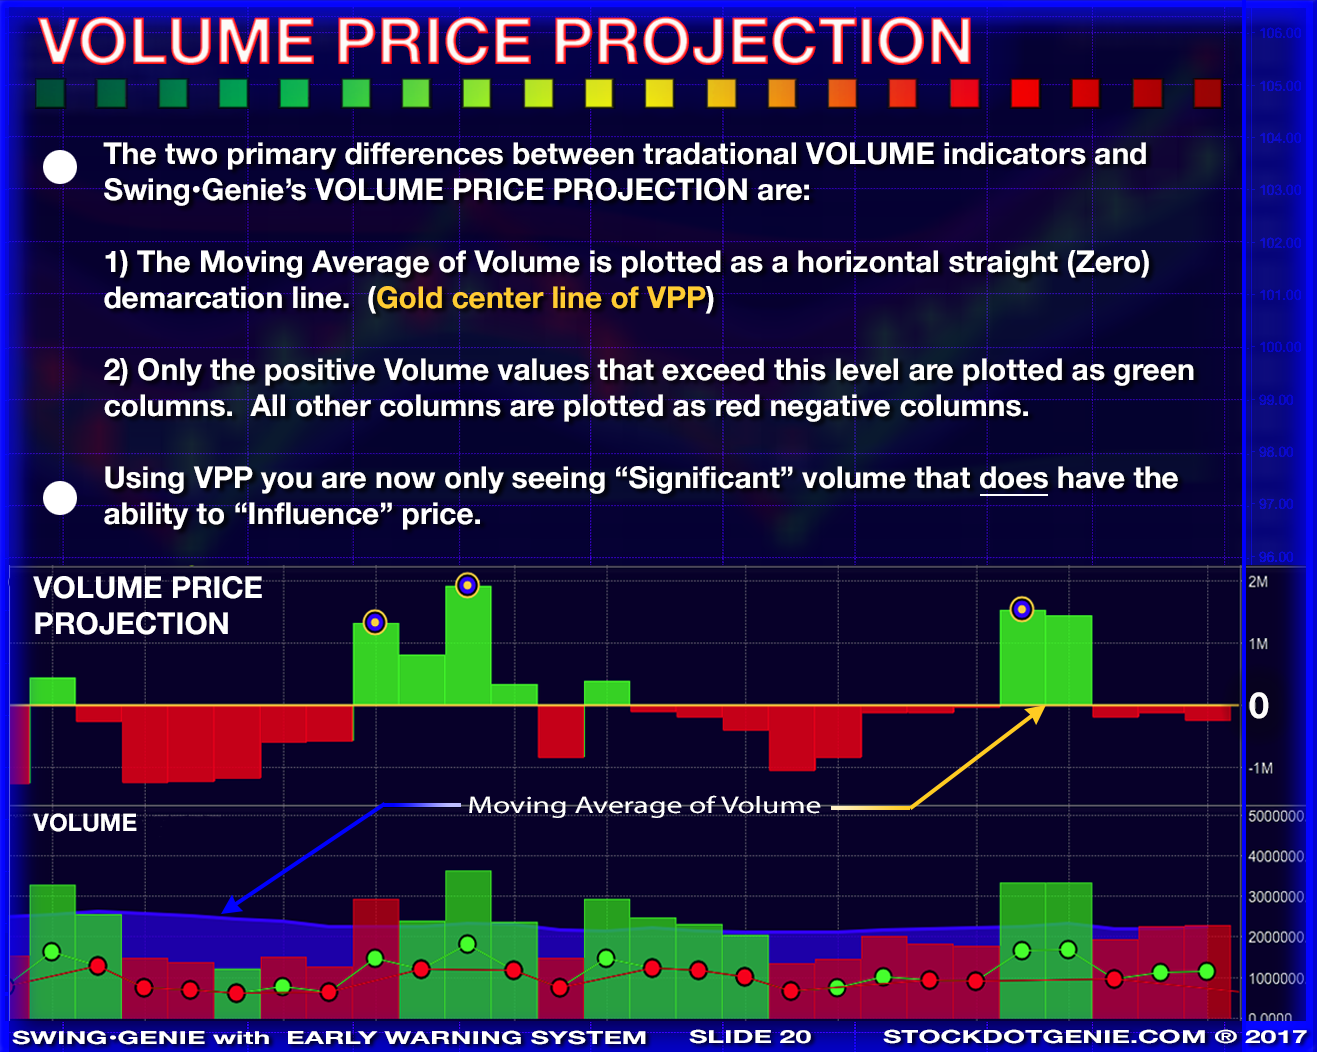
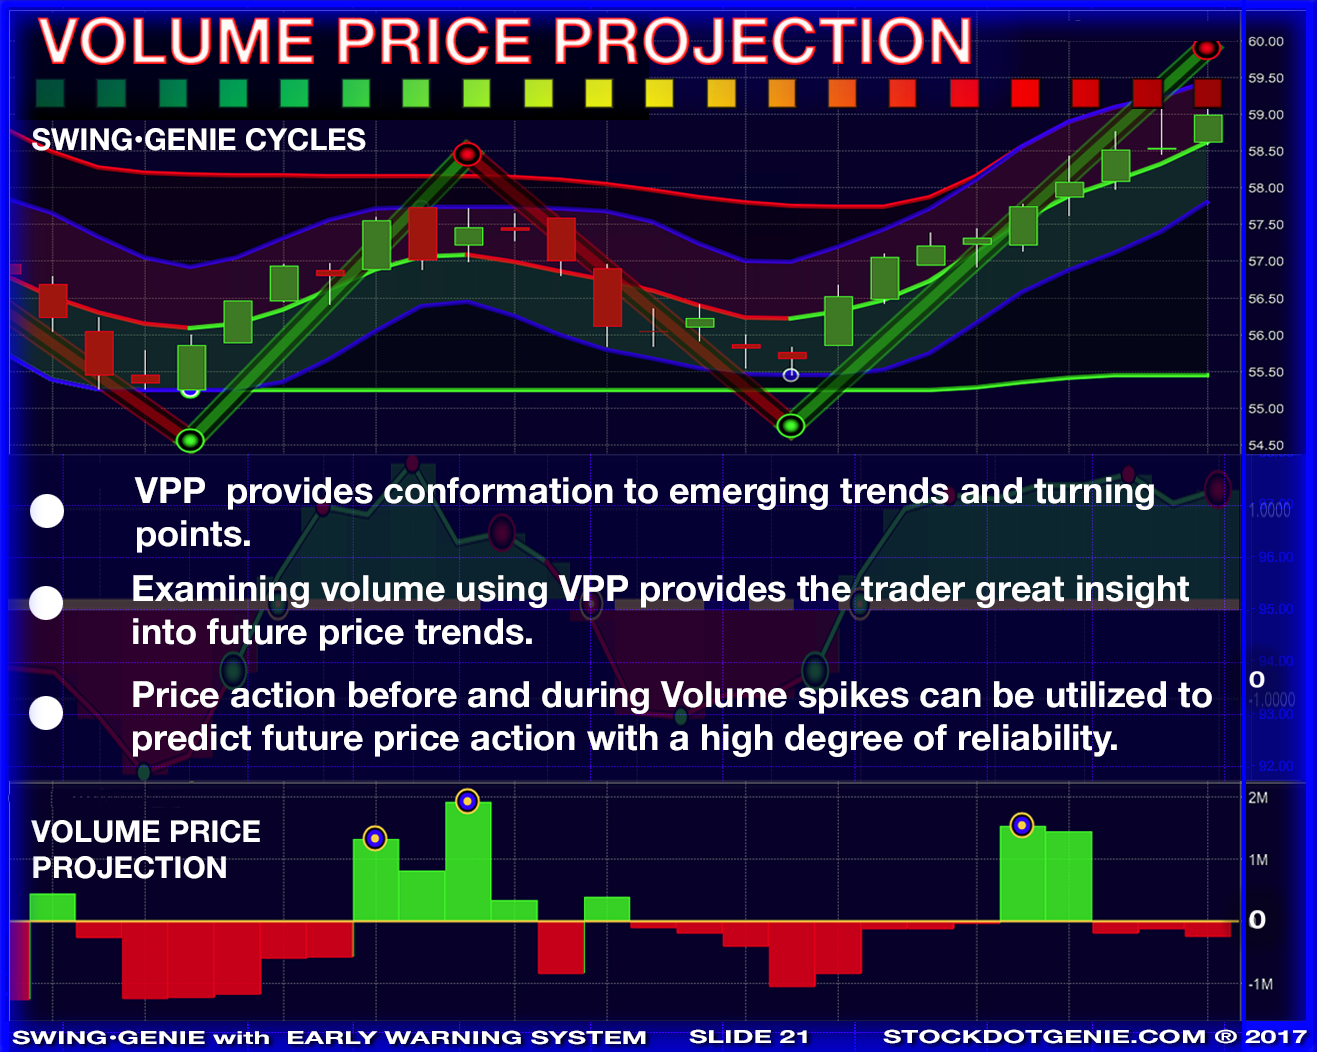
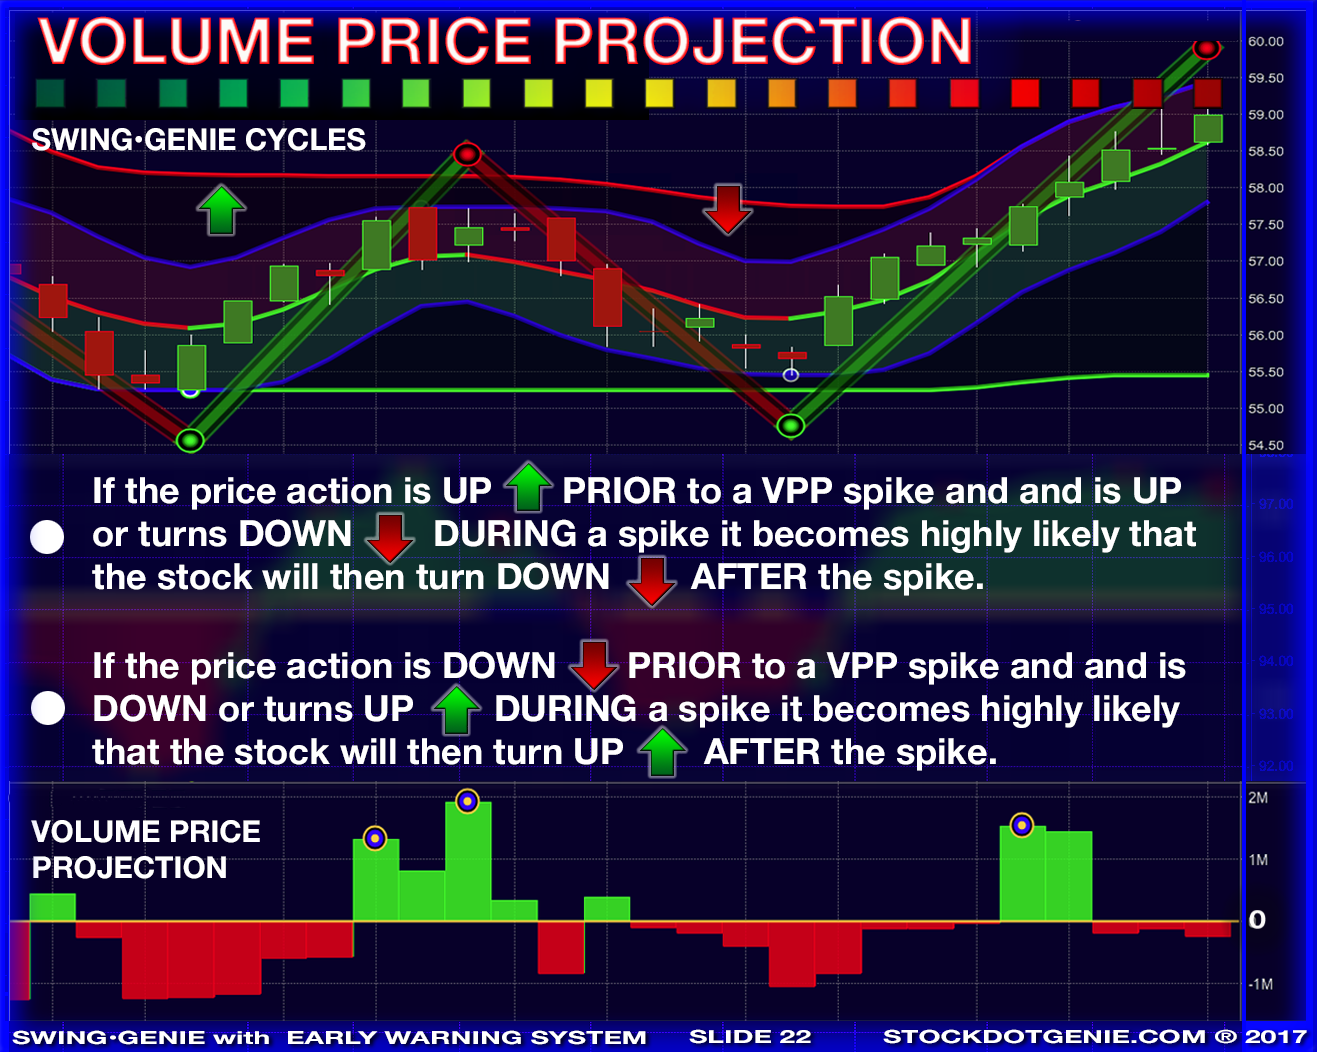
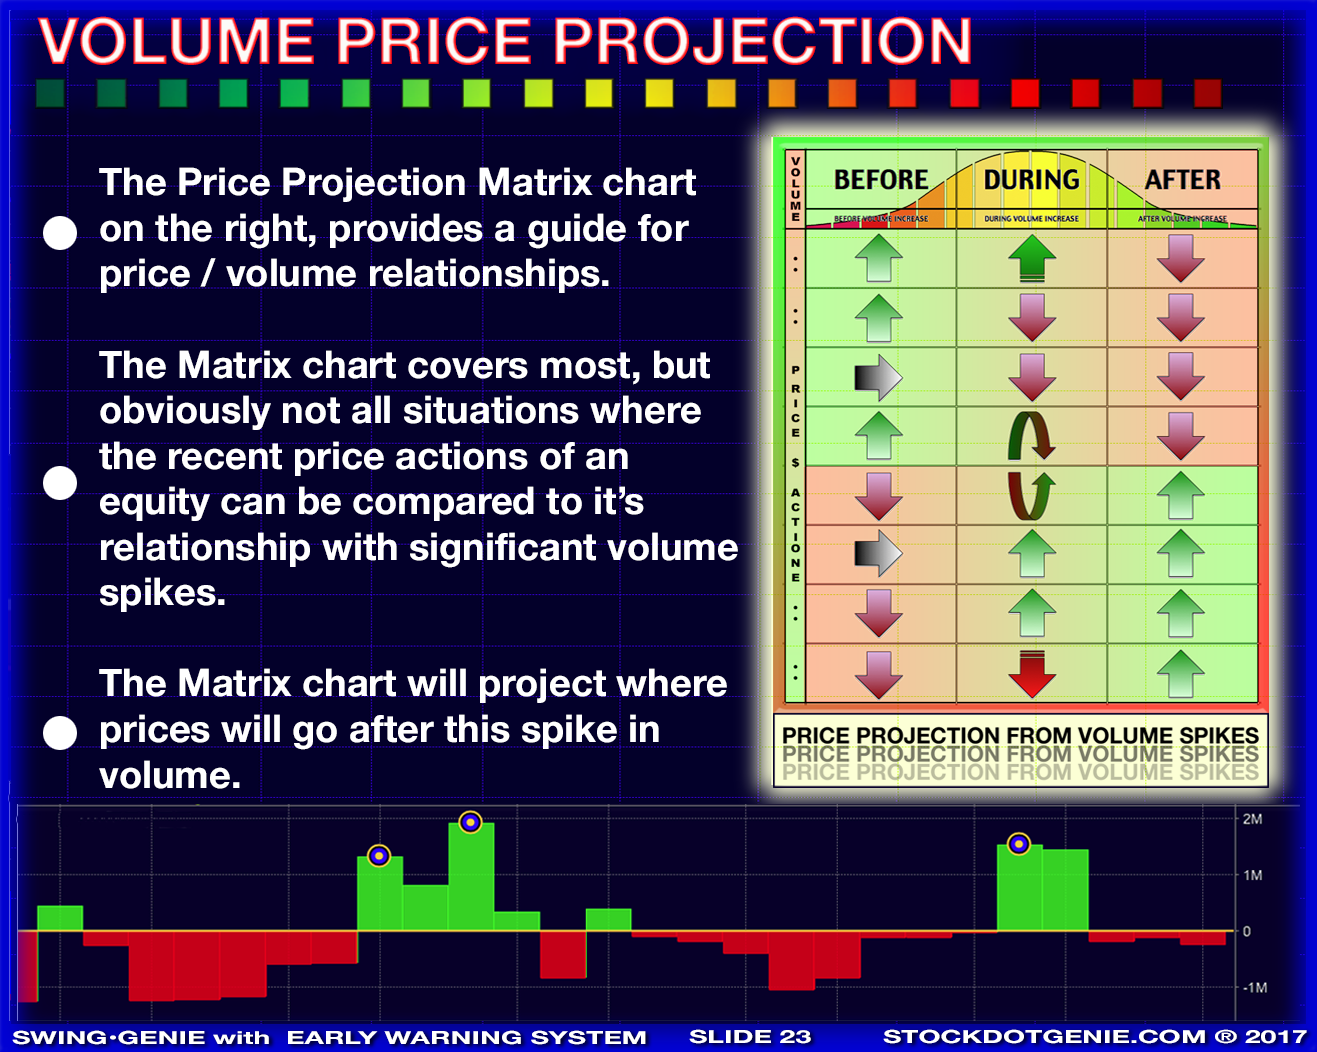
Volume Price Projection, enables traders to confirm and predict price actions going forward. It displays only the differences the current volume represents above or below the current moving average of volume . This isolates only significant volume events for the trader. When utilized in combination with a simple volume/price matrix chart, (shown on right in image at right) traders are provided with a powerful tool-set, alerting traders of potential opportunities while providing strong conformations of your trading decisions.
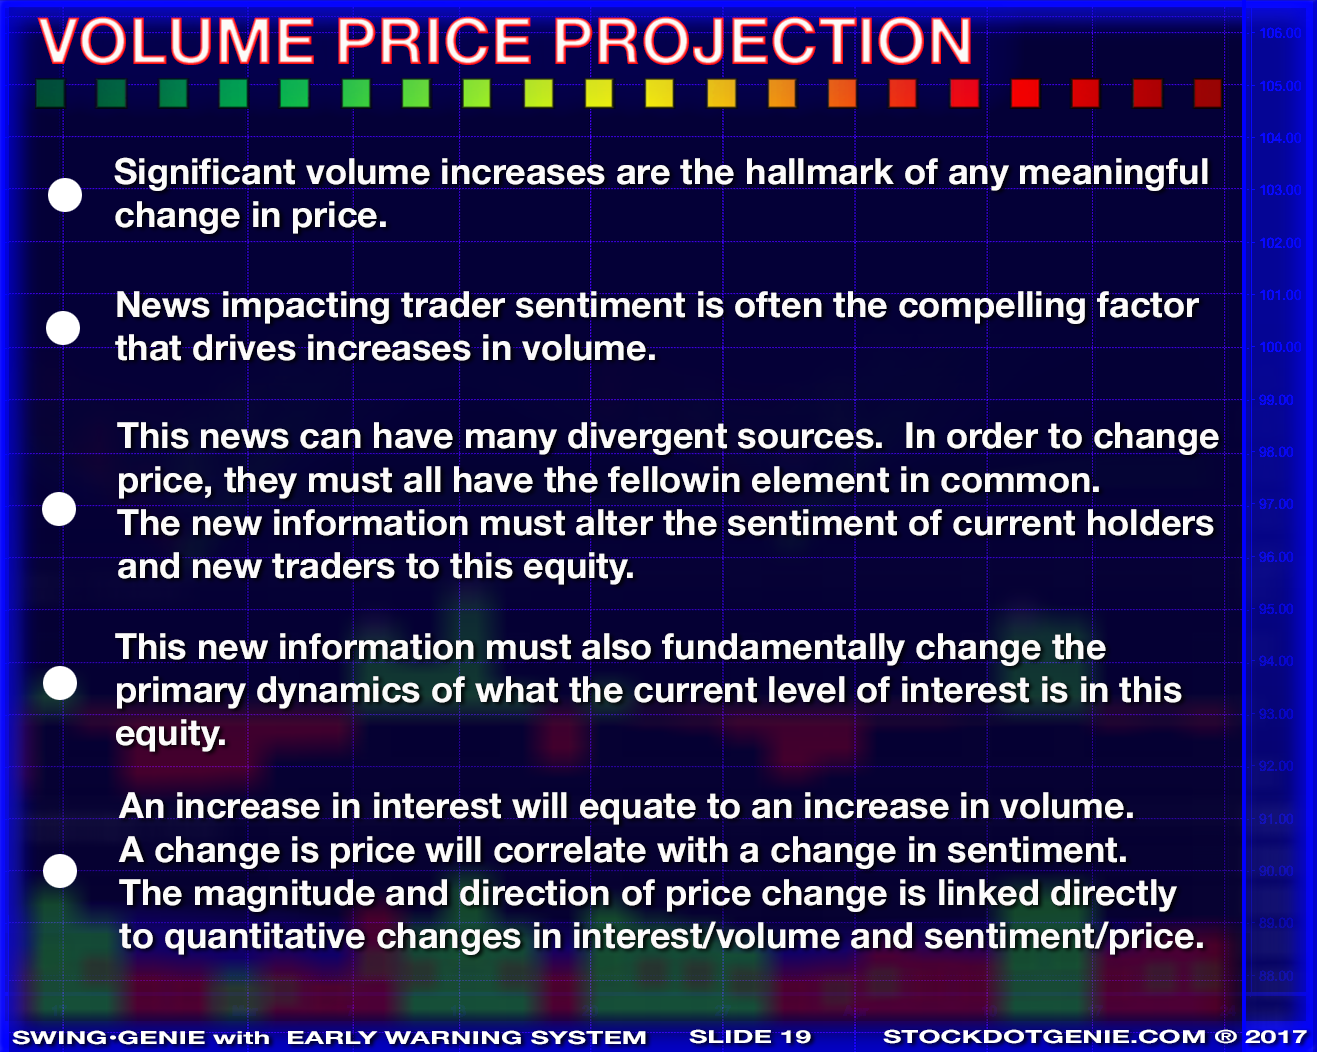
Volume is a direct reflection of the current level of interest in this equity. What is important about interest levels, regardless of sentiment (positive or negative,) produced by any event, is if the event or news is to have an impact on share price, the volume will increase as a result. This volume increase provides the liquidity required to allow market dynamics to fuel changes in price. This makes significant volume increases the hallmark of any meaningful changes, first in interest, which results in higher volume , and second, in influencing sentiment with the end result being a change in price.
We consider volume increases over the moving average of volume (significant volume increases) to be such an important trading principal that the blue background flag it triggers is built into all other Genie Indicators.
Volume Price Projection was originally published in the Journal of Technical Analysis of Stocks and Commodities ; Oct., 2017. by Michael Slattery.
Access this Genie indicator for your Tradingview account, through our web site. (Links Below) This will provide you with additional educational information and reference articles, videos, input and setting options and trading strategies this indicator excels in.


Volume Price Projection Slide Show

Slides can be advanced by clicking on the large slide, using thumbnails above or the "<" ">" controls provided at the left and right edge of each slide.
The fellowing page provides a bookmarkable chart for:
VOLUME-PRICE PROJECTION MATRIX
FINDING STOCKS TO TRADE USING A Volume SCREENER in Finviz
You can find great candidate stocks to trade using a simple and free screening process. Go to finviz.com and click on their "screener" tab. Below is the header of this stock search engine.

You can see that if you do not enter any limiting parameters, on the date this screen was set up, 7091 stocks where returned. Each and every input you add will further refine and reduce the total number of returned stock.

We are attempting to find volume spikes that are significantly above the normal daily volume. By entering the following parameters we reduce the total number of returned stocks to 167. (1) Average Volume [Over 200K] (2) Relative Volume [Over 2] and (3) Current Volume [Over 400K].
By moving to another screen also on the Finviz site, under the "Groups" tab, you can now easily see which segment(s) of the market is making the most aggressive moves.

You can now choose which segment of the market you wish to target based on performance of each segment. You now want to go back to the "Screener" tab and enter the segment.

By entering the Sector, in this case, I used my favorite group, Technology, the total number of returned stock is reduced to 29. You now have a targeted list of stock that you can apply the Volume Price Projection indicator in combination with the Volume/Price Matrix Chart Chart to find great candidates to trade utilizing the Swing•Genie Indicator.


