


The TIME WARP IMMEDIATE SWING TRADING SYSTEM (TWISTS) utilizes multiple, advanced, Laguerre Filters that are more reactive, while at the same time smoother with less volatility, than moving average indicators. This dramatically reduces the occurrence of false entries and whipsaw trades. TheTWISTS indicator further increases the profitability of your short term trades by implementing a specific rule-set, that gets you into the trade after a positive uptrend has been both; initiated and confirmed. This rule set also creates immediate exit signals as soon as the indicator detects a counter trend direction. The combination of these advantages increase your chances of extracting profits from short-term, volatile trading situations.


TWISTS is a triple moving average trading system using an advanced smoothing filter developed by John Ehlers. You can read about this dramatic advancement in moving averages in the following article:
“TIME WARP – WITHOUT SPACE TRAVEL,” by John F. Ehlers.
The schematic of the averaging and weighting processes utilized by this filter are provided below.

Ehlers’s Laguerre filters are more reactive to price changes and are smoother than short term moving averages that have the same level of reactivity. Because this system excels at removing and reducing whipsaws from volatile trading periods, the filter enables traders to enter and exit trades at the earliest, and most profitable opportunities.

TWISTS adds a simple, but very effective twist to utilizing a multiple moving average crossover systems, enabling the effective and profitable trading of any stock or commodity. This enables trend, swing and day traders to dramatically improve their results over a similar, short-term simple, smoothed, exponential or weighted moving average crossover system.
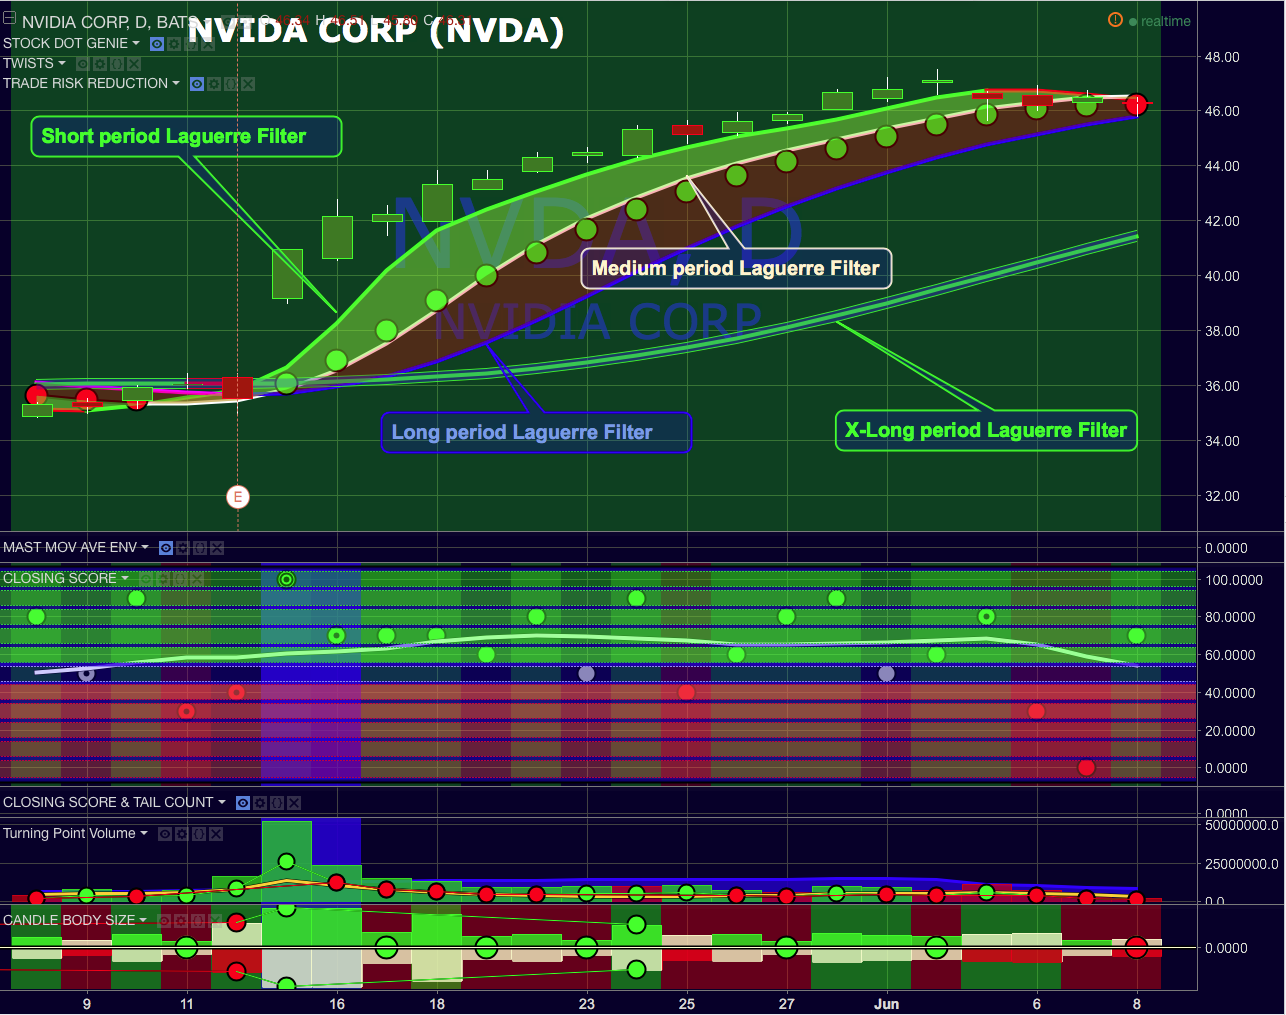
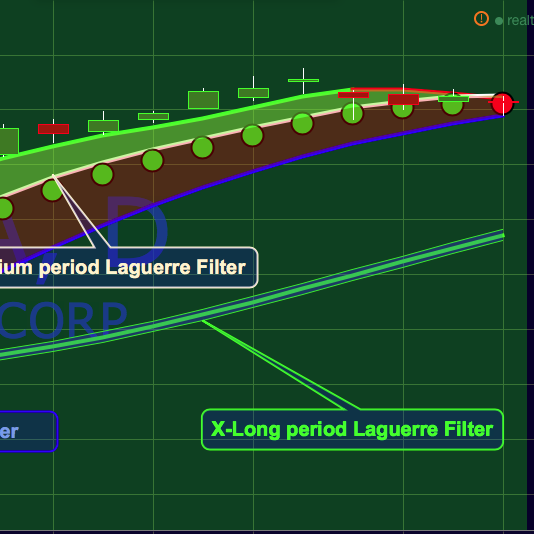
Four distinct Laguerre filters are applied to the price, one fast, one medium one long and one very long. The default settings are: Short = 0; Medium = 0.33, Long = 0.55 Xlong = 0.77. The correlation between the length of time and the Laguerre output is adjustable in the format > inputs pane (1 - 4) for this indicator and are referred to as gamma. The first three lengths produce two major bands or ribbons. During up trends the top band is filled with green and during down trends this top band will be filled with red. Obviously these bands or ribbons are twisting or flipping positions when the direction of the price trends change. Trading indicator dots are produced during both phases. Green dots for uptrends and red dots during down trends. During consolidation phases it is possible that there will be no dots produced because of the rule set applied to these Entry/hold and Exit/short indicator dots.

The following simple rule sets govern the generation of buy (green dot – green ribbon) and sell (red dot – red ribbon) trading indicators.
1) When the short length is above the medium length and the medium length is above the long length you enter a long trade. This is indicated by a reversal of the background bands and the production of a green entry dot. The requirement of two periods of time crossing above their immediate predecessor increases the probability that you are actually seeing a new trend direction and not getting trapped by any whipsaw volatility introduced by the shorter gamma settings.

2) Exit signals are simpler and more reactive to get you out of a trade (reducing drawdown) that has or is turning against your long position. When the short length moves below the medium length the system reverses the bands and generates a red dot.

3) The XLong period enables you to view the prevailing long-term trend. It consists of a single broad line flanked by two very narrow lines and filled with a blue background. The XLong period is approximately 70 days / bars in length. Note that for a swing, trend or day trading system 70 days is a long period of time.
The TWISTS trading system is a short-term system that enters and exits trades in a Swing Trading time-frame of just a few bars. This makes the TWISTS system ideal for Day-Trading at 1 or 5 minute intervals. It will keep you in / (long) or out / (short) of a trade for as long as the trade’s trend remains your friend, also making it a valuable Trend Trading tool.
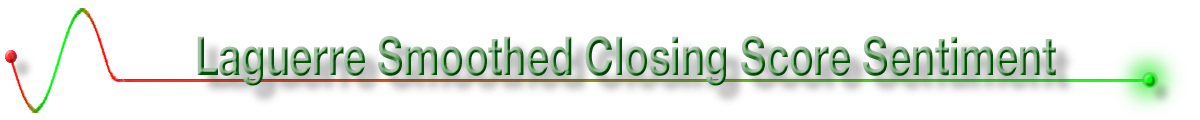
Closing Score sentiment tracks price trends in a very accurate way when examining the prevailing trend of the Closing Score. Utilizing this information the prevailing sentiment is indicated as a red/negative or green/positive, background flags within the TWISTS indicator. A Laguerre filter is applied to the underlaying Closing Score data producing this output. This is adjustable in the Format pallet under "5) Sentiment Sensitivity."

All moving average systems become less accurate at crossover points. When a stock reaches either its base or apex of any swing trajectory, it can often consolidate at this point, moving sideways until a new direction / trajectory is re-established. This can produce several choppy bars resulting in multiple entry / exit signals in a short period of time during a consolidation phase. The TWISTS rule set helps to mitigate this problem somewhat, but does not entirely eliminate it in volatle situations.
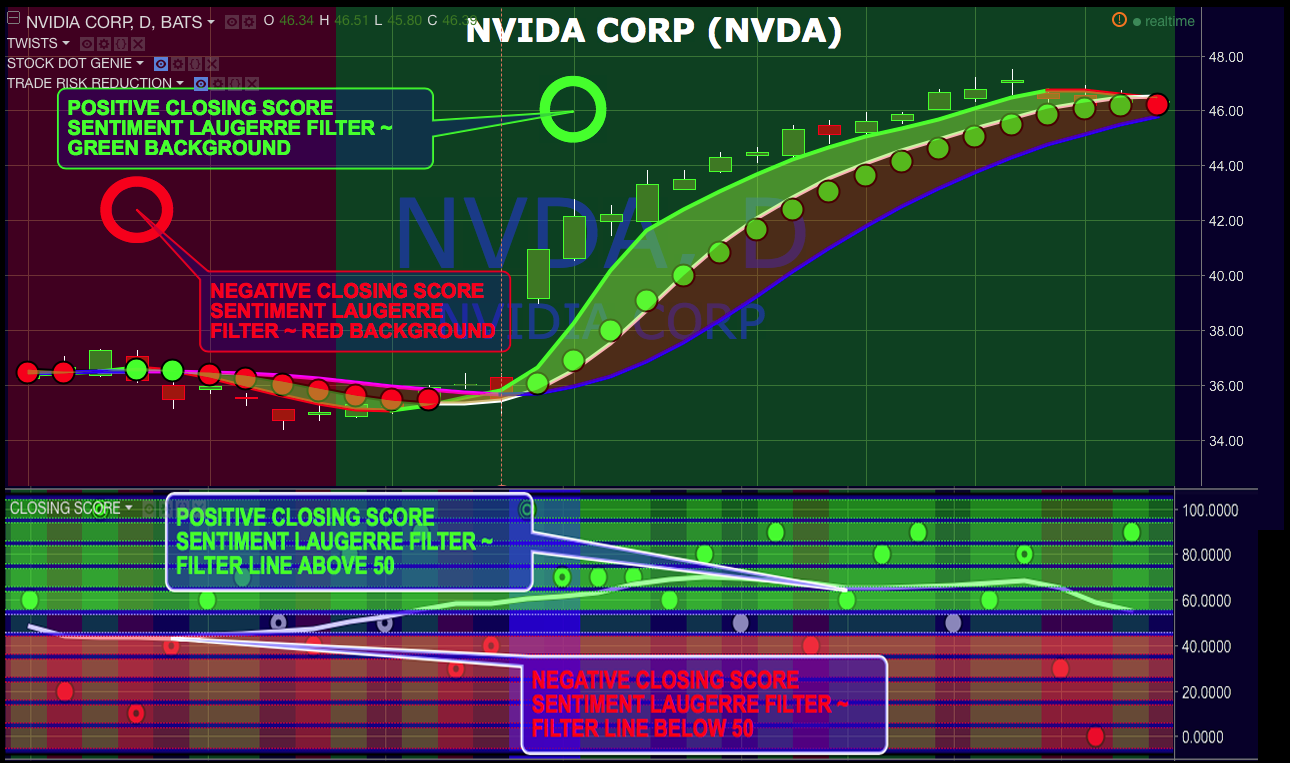
Three tools can help you determine if this is occurring. Whenever the Laguerre filters lines are converging you need to become aware if the stock or equity has entered a consolidation or flat trading range. A light red or gold background indicates areas of consolidation. These lighter backgrounds are produced by a constriction of Bollinger bands or the constriction of two linear regression calculations as seen in the image above.

The third tool in this process is when the Laugerre filter is in neutral territory of the Closing Score indicator. The Laugerre filter line is white when turned on in the Closing Score indicator. The neutral range resides between 45 and 55.
You can turn on or off the consolidation background flags using the Format > Inputs pallets. Option 10 and 11 will allow you to do this by the type of indicator producing the flags. The parameters of the consolidation or horizontal trading background fills are adjustable in the format pallet under "6) Consolidation Factor Less than ?" This enable you to widen or narrow the distance between these bands to dial in more accurate consolidation periods depending on the trading range and volatility of your equity.

If you see a lighter red, or green backgrounds, then you need to exercise additional caution and wait for an additional or second trading indicator dot (2) before entering or exiting a trade. A definitive candle that clearly establishes the demarcation point of a new trend direction can also provide this secondary signal. This secondary candle signal is strongest when conformed by an increase in volume from the previous bar. These candles will also end the consolidation background colors.
The XLong Laguerre indicator also provides you with an indication of the overall prevailing trend and your equity will continue following that trend direction more often than not. After any consolidation a new trend can easily be in the same direction as the previous trend. You can adjust the settings to reduce the number of false signals, but completely eliminating all false signals is unlikely. Multiple trading signals in choppy areas including consolidation areas are inherent in very reactive indicators. Laguerre filters provide the best compromise between limiting the number of false signals and allowing you to enter and exit trades at the most profitable times. Our double cross over for entry and single crossover for exits also increases the profitability of this system.


