


TRR calculates the volatility of your stock. This is just the magnitude of each days price fluctuations, or what technicians refer to as the True Range. TRR averages the True Range (ATR) over three different time periods. Why three? You want a sensitive indicator that reflect both the long term historical volatility of the equity as well as what that volatility is right now. Obviously the most recent trading days are the most important. The three ATR periods and their weighting factors are:
This results in the Weighted Average True Range that the Trade Risk Reduction utilizes to produce the dynamic bands on your charts as well as power the Risk and Stop loss calculators. These indicate where this indicator is currently recommending you place stops. In the Format options of the application you are provided with the ability to adjust these band. Keep in mind that each stock will act in it's own unique and characteristic way. Looking closely at the stock's historical data, both in longer and shorter time periods should provide you with some insight into the normal variations and fluctuations of this particular equity. Below EBAY provides an example of this.
Access this Genie indicator for your Tradingview account, through our web site. (Links Below) This will provide you with additional educational information and reference articles, videos, input and setting options and trading strategies this indicator excels in.


1) We use a 251 day period which equates to 1 trading year because we want to know what the historical volatility is. This one year period is not weighted.
2) We utilize a 21 day period because the most recent weeks tells us what the stock volatility has been over the previous calendar month. This is weighted by a factor of 2.
3) Finally, we utilize the last weeks data, Last 5 days, (L5D) to provide us with the stocks movement in the most recent trading days. This is weighted by a factor of 4.
The total of ATR251*(1) + ATR21*(2) + ATR5*(4) is then divided by the total of all factors (7).
This results in the Weighted Average True Range that the Trade Risk Reduction utilizes to produce the dynamic bands on your charts as well as power the Risk and Stop loss calculators. These indicate where this indicator is currently recommending you place stops. In the Format options of the application you are provided with the ability to adjust these band. Keep in mind that each stock will act in it's own unique and characteristic way. Looking closely at the stock's historical data, both in longer and shorter time periods should provide you with some insight into the normal variations and fluctuations of this particular equity. Below EBAY provides an example of this.
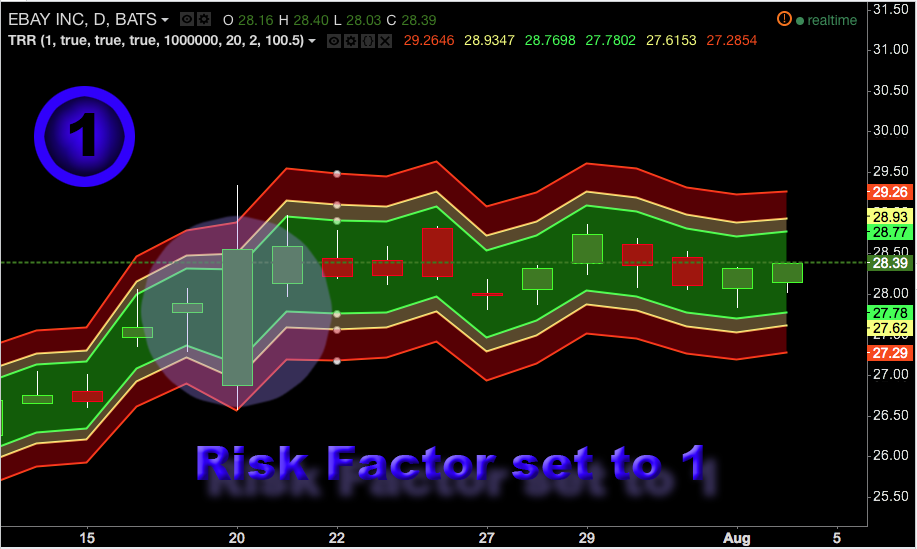


In the EBAY chart above (click on chart to enlarge) in image (1) you can see that setting the Risk Factor Adjustment to 1 would have stopped you out because of an unusually wide ranging candle. Set to 2 it would have still been possible to get stopped out using the tightest stops, (C) 1/4 of the weighted Average True Range producing green lines. Using the Gold lines which are adjusted to draw lines utilizing 1/3 of the weighted ATF volatility factor would have kept you in the trade. Set to three you are now safe but your spread has widened to a point that the volatility is unlike to exit you without some extreme change in price. Click on the images above to view them in a light box. The challenge is to set safety parameters without getting shaken out of a trade by a statistical anomaly.
The take home message is even though this is automatically adjusting the suggested stops, you should review every chart for historical aberrations and select the ATR trend line and volatility factor that makes you the most comfortable for each separate trade. Us the following calculation to set trailing stop losses with your broker. Take the (Current Price - Stop Loss Price / Current Price). This will provide you with a percentage to enter into you trading system that will maintain a safety bubble around you trade.
An addational advantage is this process allmost always places your stops at the best possiable price to provide you with the greatest safety margin, but at a price point that often eleminates your stops from the gamming that sometimes occures where there are overt attempts to trigger stops.
The higher the volatility the more your should reduce the total number of shares you buy in this equity. This same application automatically determines is you share sizing should be increase for a stock with very low volatility or decrease those shares in a volatile stock.
SDG's TRR will determine this level automatically for you and again this calculation is derived by utilizing the weighted volitility factor.
A good article on sizing your trades can be found on the American Association of Individual Investors website.


